Weis Waves Wyckoff
- Indicadores
- Versión: 2.0
- Activaciones: 5

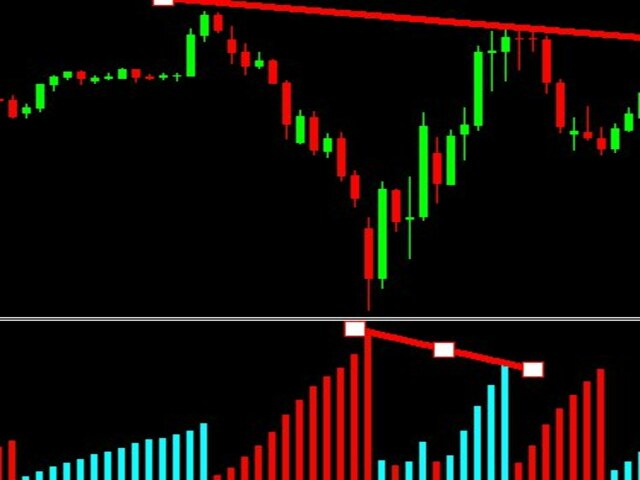
a través de este indicador usted puede hacer análisis y también puede distinguir posible debilidad o fuerza continua en el precio, es un indicador desarrollado inicialmente por David Weis. Esta versión es para la plataforma meta trader 5. El indicador Weis Waves se basa en el volumen y se alinea con el precio, pudiendo encontrar no solo posibles fortalezas y debilidades, sino también posibles divergencias entre precio y volumen, aportando un interesante análisis entre ambos.