BeST 123 Startegy MT5
- Indicadores
- Versión: 1.20
- Actualizado: 16 junio 2021
- Activaciones: 10

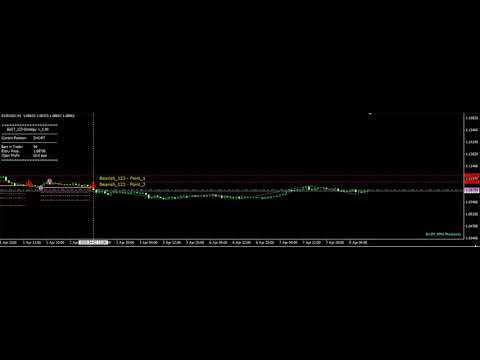
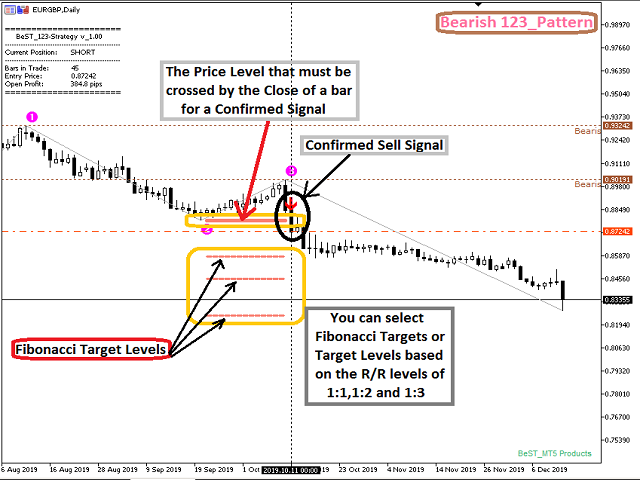
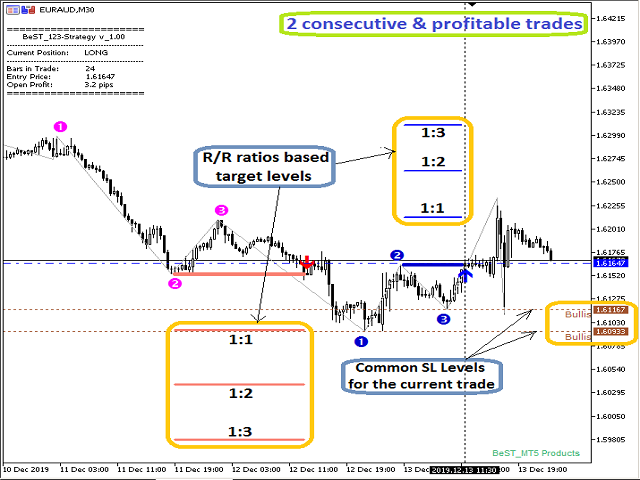
La Estrategia BeST_123 se basa claramente en el Patrón 123 que es un Patrón Gráfico de Reversión frecuente de un Ratio de Éxito muy alto.Ocurre al final de las tendencias y oscilaciones y es una indicación seria de alta probabilidad de un cambio de tendencia.Teóricamente un patrón 123 es válido cuando el precio cierra más allá del nivel del #2 tope/fondo local, momento en el que el indicador dibuja una Flecha de Entrada, levanta una Alerta, y se puede abrir una Posición correspondiente.
El indicador BeST 123_Strategy no repinta ni retropinta, y al utilizarlo puede obtener:
- Señales de entrada definitivas
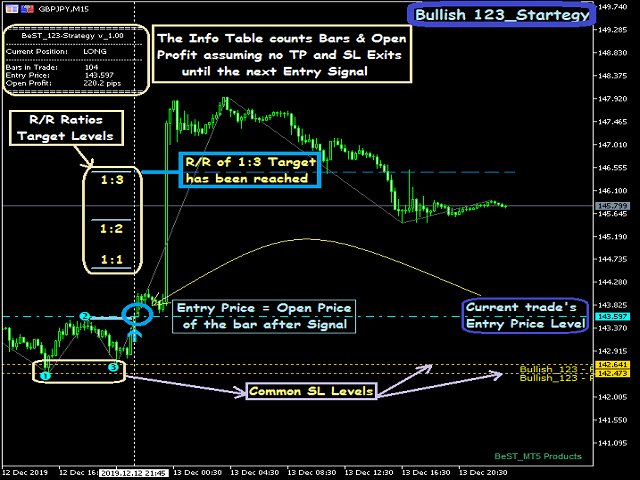
- Puntos TP basados en Niveles de Fibonnacci o Ratios de Riesgo/Recompensa
- Los Niveles SL comunes usuales para el 123_Patrón (los puntos #1 y #3 de la formación integrada actual)
- Todas las Alertas de Metatrader para las Señales de Entrada
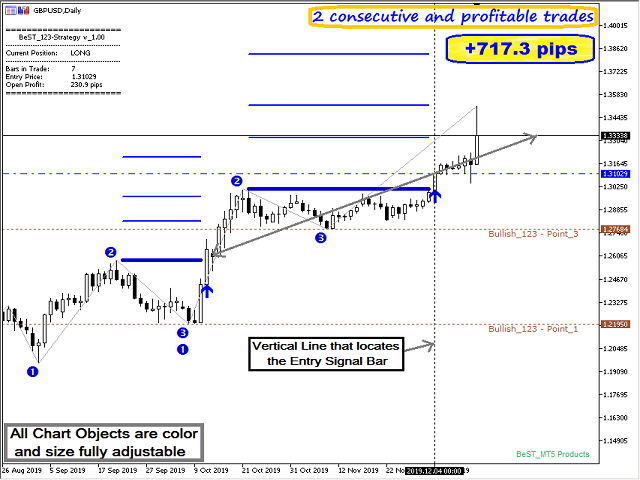
- Colores y tamaños totalmente personalizables de todos los objetos del gráfico
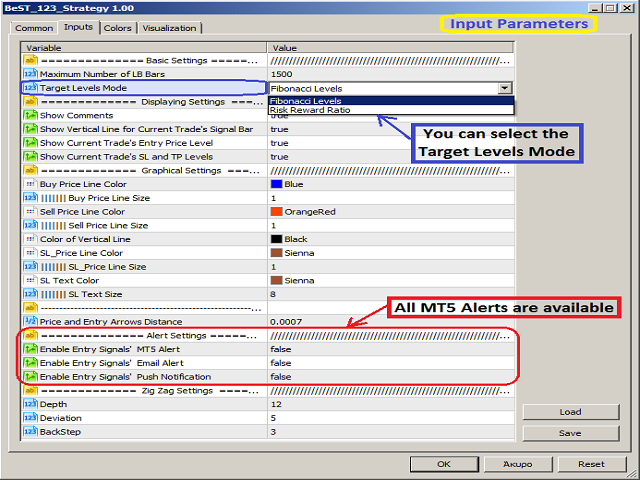
Entradas
Ajustes Básicos
- Número Máximo de Barras LB - Periodo LB de búsqueda del 123_Patrón
- Modo de Niveles Objetivo - para seleccionar Niveles Objetivo Fibonacci o Niveles Objetivo R/R Ratio
Configuración de visualización - para seleccionar qué objetos y características del gráfico mostrar/activar.
Ajustes Gráficos - para seleccionar el color, tamaño y distancias de los objetos dibujados.
Configuración de Alertas - para controlar el uso de las Alertas de Entrada MT5.
Configuración de Zig Zag - para seleccionar los parámetros del Indicador ZZ que se utiliza para detectar los máximos y mínimos del swing.
Nota:
Toda la información de la tabla de comentarios se actualiza en tiempo real y cuenta las barras en la operación y el beneficio abierto de la operación actual, pero asumiendo que no hay salidas objetivo hasta la siguiente señal de entrada.
Para Desarrolladores EA
Flecha de Compra: Buffer = 23
Flecha de Venta: Buffer = 24


absolutely well made and useful indicator, highly recommended