Pentagram
- Indicadores
- Versión: 2.60
- Actualizado: 22 enero 2022
- Activaciones: 5

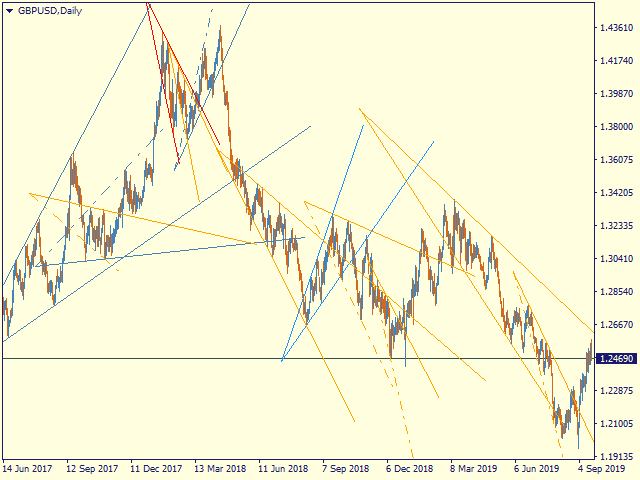
Marcado automático de la carta con modelos de Pentagramas.
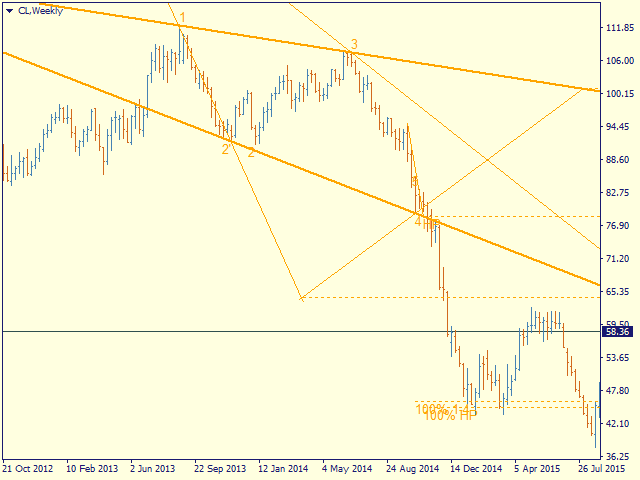
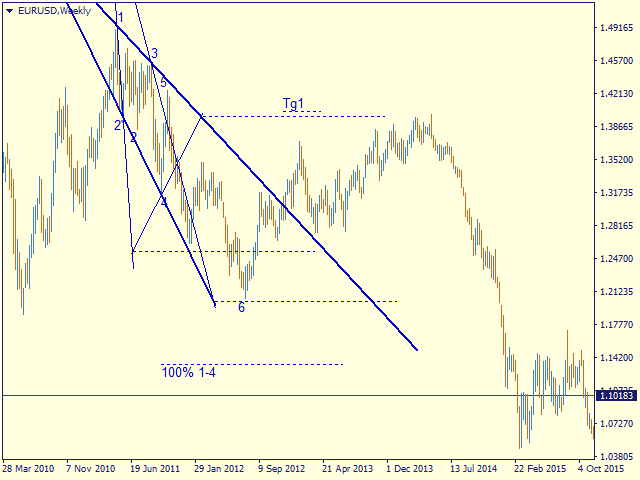
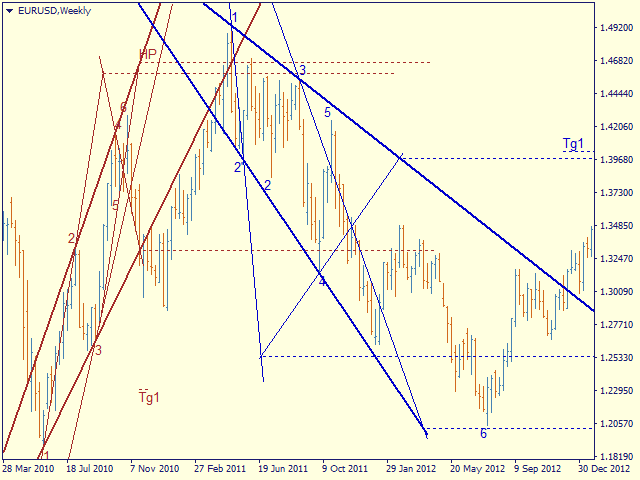
Este modelo se basa en el Modelo de Expansión de Adversa Tactics. Diseñado para determinar la tendencia y predecir posibles niveles y objetivos de corrección de precios en el futuro.
El modelo describe una tendencia en desarrollo.
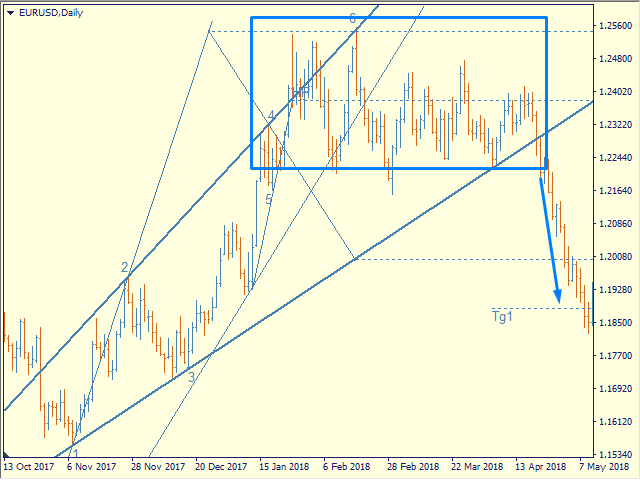
La tendencia es relevante hasta que el precio cruza la línea de tendencia del modelo en la dirección opuesta.
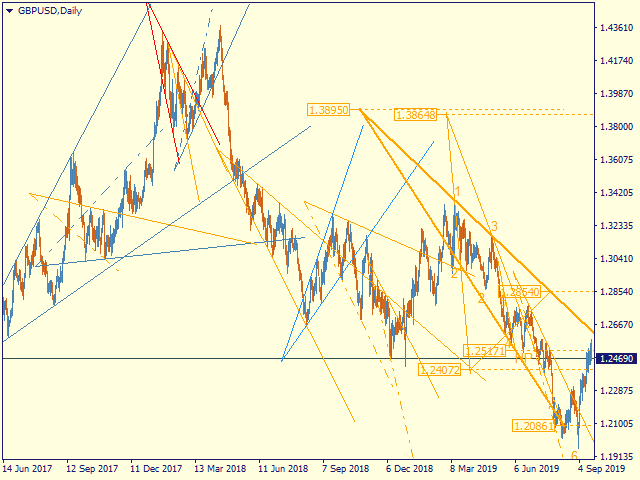
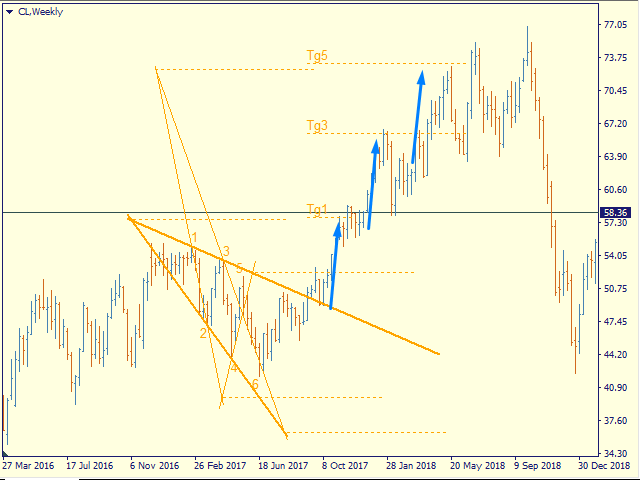
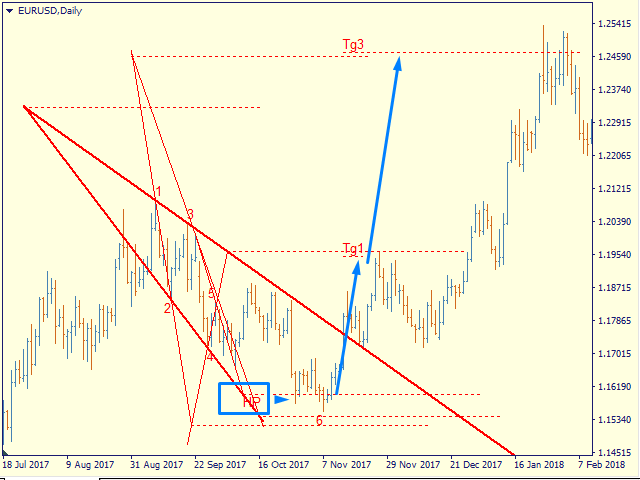
Los niveles de los rayos del pentagrama, el nivel de HP, las distancias del 100% y 200% de la distancia entre los puntos 1-4, los niveles de HP son posibles niveles de corrección o el final de la tendencia.
Si el nivel de HP se alcanza consistentemente, se espera un retroceso a t4, t5, la línea de tendencia seguida de una ruptura, el logro sucesivo de los niveles objetivo tg1..tg5.
Opciones
- = indicador = - - general
ChartType- laforma de construir modelos - por Close o por High / Low (gráfico de líneas o velas japonesas)
MaxBarsToCalculate - profundidad de la historia para el marcado por modelos
Select New Model - seleccionar o no nuevos modelos
Font size for price labels - tamaño de fuente para etiquetas de precios en niveles de modelos
Font size for point labels - tamaño de fuente para la numeración de puntos de modelos
--= Configurar Alertas =-- - Configurar Alertas
Activar Alertas - conmutador general
Alerta1..Alerta5- seleccionar hasta 5 eventos diferentes
Alerta PopUp- habilitar popup
Alerta de correo electrónico- habilitar el correo electrónico, se requiere configurar el correo en el terminal
Alerta de NotificacionesPush - permitir respuestas a terminales móviles, requiere permitir mensajes Push en la configuración del terminal
Sonido de alerta - habilitar sonido
--= Reglas del modelo =-- - configurar los parámetros del modelo
Barras para el punto 4 - número de barras para fijar el punto de referencia 4
Habilitar 4' en el modelo - habilitar la construcción en el punto tangente 4
Base mínima (1-3), barras - eltamaño mínimo permitido de la base del modelo (distancia entre los puntos 1 y 3)
Tamaño máximo del modelo (1-4) - eltamaño máximo permitido del modelo (distancia entre los puntos 1 y 4)
Longitud LT en CP-4 - lalongitud de la línea de tendencia en el gráfico en unidades CP-4 - la distancia entre el punto sacro y el punto 4
Distancia máxima CP de 1 en 1-3 - ladistancia máxima permitida del punto sacro, en la que el modelo todavía se puede considerar en expansión
- = Esquema de colores = - - esquema de colores de los modelos en función de la ubicación en la tendencia
clrUpTrend - modeloascendente desde el inicio de la tendencia
clrDnTrend - pauta descendente desde el inicio de latendencia
clrUpCorrection - modelo correctivo
clrDnCorrection- - // -
clrUpContinuation - modelo de continuación
clrDnContinuation - - // -
- = Opciones del gráfico = - - visualización de niveles
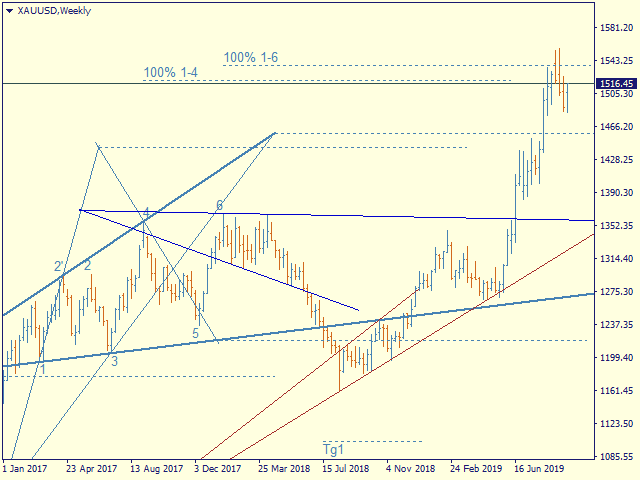
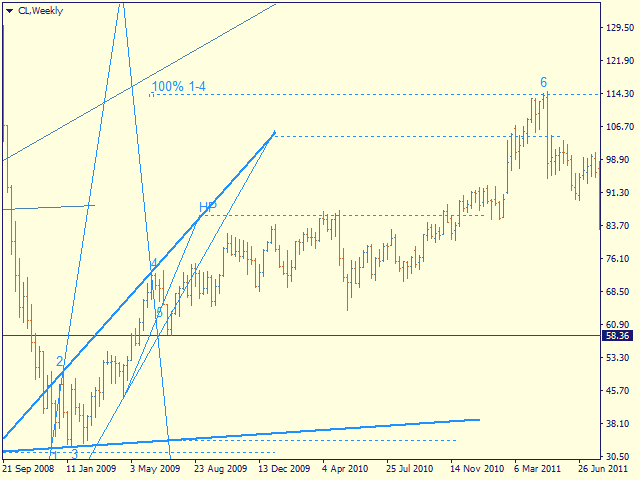
Mostrar siempre 100% 1-4 - 100% 1-4, la distancia entre los puntos 1 y 4 del modelo diferida desde el punto 4
Show_Tg1_100 -100% 1er objetivo
showTg3 - objetivo 3
showTg4 - objetivo 4
showTg5 - objetivo 5
- = Barras de control = - - visualización de los puntos de control
showLinkBar, showBreakLT, showLastBar,showPiclose- puntos experimentales, desactivados por defecto
Control de la visualización y el detalle de modelos
Puede seleccionar el modelo de interés haciendo clic con el botón izquierdo del ratón
1er clic - el modelo se resalta con líneas en negrita
2º clic -muestra detalles del modelo, etiquetas de precios, puntos de control
3er clic -anular la selección
Teclas de acceso rápido
S - ocultar / mostrar modelos, excepto los seleccionados
> -seleccionar el modelo siguiente
< -seleccionar el modelo anterior
ESC - cancelar todas las selecciones