FFx RSI Dashboard MTF ALERTER
- Indicadores
-
Eric Venturi-Bloxs
 Below some of my FFx trading tools available on MQL:
For MT5 platform:
- FFx Pivot SR Suite: https://www.mql5.com/en/market/product/25794 - Versión: 1.3
- Actualizado: 16 junio 2021
- Activaciones: 20
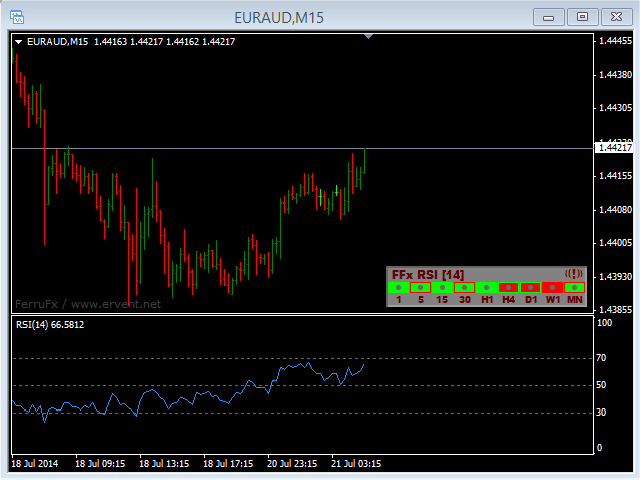
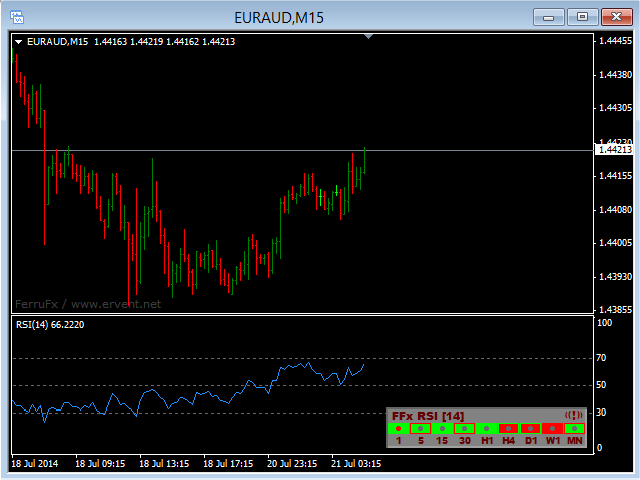
El alertador FFx Dashboard MTF le mostrará en un solo gráfico todos los marcos temporales (M1 a Mensual) con su propio estado para el indicador.
2 Opciones de Alerta:
- Single timeframe: cada timeframe seleccionado alerta por separado cuando se produce una señal
- Multi timeframes: todos los timeframes seleccionados deben coincidir para que se active una alerta
Ambas opciones tienen una entrada para seleccionar los plazos que se utilizarán para la(s) alerta(s).
Cómo entender el estado:
- Cuadrado verde/rojo: RSI por encima/por debajo de la línea 50
- Cuadrado verde + borde rojo: RSI por encima de 50 pero apuntando a la baja
- Cuadrado rojo + borde verde: RSI por debajo de 50 pero apuntando al alza
- Punto verde/rojo: RSI en zona de sobrecompra/sobreventa
Opciones disponibles en el Alerter del Tablero FFx:
- Seleccione los plazos para activar las alertas
- Alerta emergente/sonido/email/push
- Activar/desactivar la alerta directamente en el gráfico
- Posición en el gráfico
- ... y por supuesto todos los ajustes habituales del indicador estándar
Cómo configurar la alerta:
En la ventana emergente de parámetros: seleccione la alerta que desee y el modo de alerta (emergente y/o sonido y/o correo electrónico y/o notificación push)
En el gráfico: haga clic en el icono ((!)). Cambiará de color indicando que ha cambiado de estado. De rojo a verde significa que ahora está activada... De verde a rojo significa que ahora está desactivada.
El usuario no ha dejado ningún comentario para su valoración