TickChart Indicator for MT5
- Indicadores
-
Mika Akimoto
 Developing tools for MT4 and MT5.
 - Versión: 1.1
- Activaciones: 5
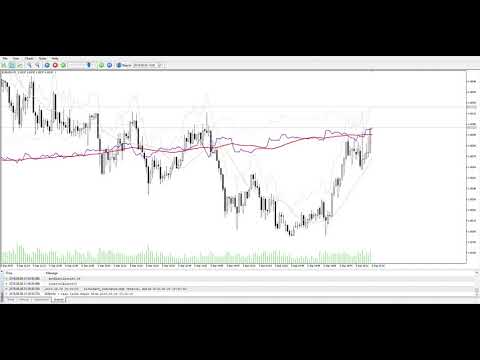
TickChart Indicador traza la línea de garrapatas en la ventana principal de MetaTrader.
( La versión gratuita es "TickChart Indicator Lite" )
La línea de ticks muestra las actividades más detalladas, rápidas y en tiempo real del mercado, que suelen estar ocultas en barras o velas de más de 1 minuto. Normalmente, aparecen varios segmentos nuevos de tick-line mientras se completa una barra del marco temporal M1. Tras la publicación de un indicador económico importante, el número de ticks por barra puede superar los 100.
Este indicador superpone la línea de ticks a los gráficos normales de las ventanas principales. Aunque los gráficos normales están en el espacio "tiempo-precio", el gráfico de ticks está en el espacio "ticks-precio", es decir, el eje X del gráfico de ticks no es el tiempo. Cuando el mercado está muy activo, el eje X del gráfico de ticks avanza rápidamente y viceversa.
El indicador TickChart puede ser útil en muchas situaciones. Por ejemplo,
- Una herramienta para scalping : Usted puede encontrar varias oportunidades en un minuto
- Encontrar oportunidades en las turbulencias tras la publicación de indicadores económicos importantes: El tick-chart muestra los cambios detallados de precios ocultos en una larga vela alcista/bajista.
- Como un electrocardiograma del mercado: El ritmo de generación de segmentos del tick-chart indica la vitalidad del mercado
- Vigilancia del mercado en varios marcos temporales: Por ejemplo, puede ver el gráfico de tick y el gráfico de marco temporal M15 en la misma ventana. Este indicador se superpone al marco temporal más corto, el tick.
- Alerta de cambios significativos en el precio: Envía un correo electrónico y/o notificaciones utilizando el RSI y la desviación Envelope.
Puede haber más usos. Si usted encuentra una buena, por favor hágamelo saber.
Entradas
| Nombre del parámetro | Descripción |
|---|---|
| Número de ticks a dibujar | Aproximadamente 200. Demasiados ticks pueden ralentizar MetaTrader |
| Ancho de la línea de tick-bid | Ancho de la línea de tick para el precio de oferta. Ancho 0 indica que no hay tick-bid-line |
| Color de la línea de tick-bid (MT5) | Color de la línea |
| Estilo de la línea de tick-bid (MT5) | Estilo de línea, sólido, puntos, ... |
| Ancho de la línea de precio de compra | Ancho de la línea de tick para el precio de venta. Ancho 0 indica que no hay tick-ask-line |
| Tick-ask-line color (MT5) | Color de la línea |
| Estilo del tick-ask-line (MT5) | Estilo de línea, sólido, puntos, ... |
| Periodo Tick-MA | Período de la SMA, es decir, cuántos ticks se utilizarán para calcular la media móvil |
| Anchura de la línea de tick-MA en bid | Ancho de la línea del tick SMA en el precio de oferta. El ancho 0 indica que no hay línea SMA |
| Estilo de línea de Tick-MA bid (MT5) | Estilo de línea |
| Tick-MA bid line color (MT5) | Color de la línea |
| Ancho de la línea Tick-MA ask | Ancho de la línea de tick SMA en el precio de venta. Ancho 0 indica que no hay línea SMA |
| Estilo de la línea Tick-MA ask (MT5) | Estilo de línea |
| Tick-Ma ask color de línea (MT5) | Color de la línea |
| Alerta email | Activa/desactiva la alerta por email. La alerta se produce cuando el RSI y la Envolvente proporcionan la misma señal de compra/venta descrita a continuación.
Si es "true", la alerta será enviada cuando ( (RSI<Nivel_inferior_del_RSI) o (RSI>Nivel_superior_del_RSI) ) y ( (desviación>nivel_de_alerta) o (desviación< -nivel_de_alerta) ) |
| Notificación de alerta | Activa/desactiva la notificación (usando la opción MetaQuotesID en MetaTrader). La misma alerta que la anterior. |
| Periodo envolvente de la alerta | Periodo envolvente de la alerta. El periodo aquí es el número de barras, no el número de ticks. |
| Periodo de alerta RSI | Periodo de alerta del RSI, el número de barras. |
| Nivel de alerta inferior del RSI | RSI menor que este valor indica que el precio está cerca de la zona de compra |
| Nivel de alerta superior del RSI | RSI superior a este valor indica que el precio está cerca de la zona de venta |
| Nivel de alerta de desviación de la envolvente | La desviación de la envolvente superior/inferior a (nivel)/(-nivel) indica que el precio está cerca de la zona de venta/compra |
| Intervalo mínimo de alerta | No enviar alerta para este intervalo especificado después de la alerta anterior para evitar demasiadas alertas en un mismo incidente |
(MT5): Sólo en la versión MetaTrader5. En la versión MetaTrader4, las propiedades de las líneas están en la propiedad del indicador.
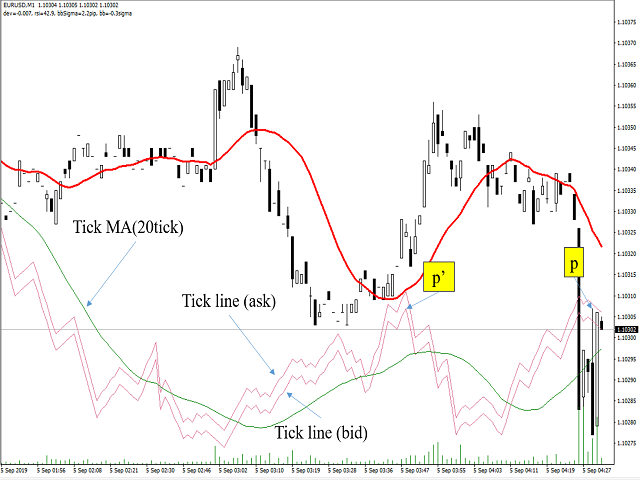
Captura de pantalla
La captura de pantalla muestra las dos líneas de precios de compra y venta y la línea 20MA. Muestra que el precio detallado cambia dentro de velas largas. El precio máximo (p) de una vela se muestra como el pico del gráfico de ticks (p'). Usted puede ver muchos máximos y mínimos dentro de una vela y encontrar más oportunidades de comercio.