Outside Days Candlestick Bulkowski
- Indicadores
- Versión: 1.0
- Activaciones: 5

Outside Days Candlestick Bulkowski
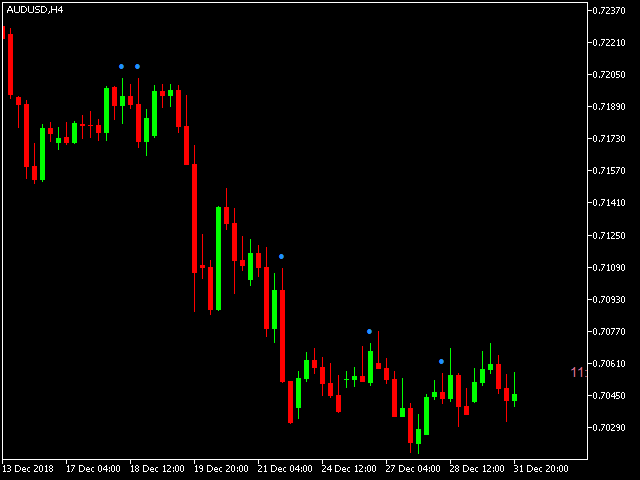
El Outside Days Candlestick es un conocido patrón de velas compuesto por dos velas.
Este indicador para mostrar fuera de días candlestick que describen por Thomas Bulkowski.
Si usted necesita para MetaTrader 4 versión, por favor visite aquí:
Características destacadas
- Mostrar días fuera de velas.
- Símbolo personalizable.
- Distancia entre el símbolo y la vela.
Parámetros de entrada
- Símbolo - Introduce el código de símbolo de "wingdings" para el candelero de fuera de día (por defecto es punto).
- DesplazamientoSímbolo - Distancia del símbolo a la vela.
- SymbolColor - Introduce el color del símbolo (outside days).
Definición de Outside Days Candlestick por Thomas Bulkowski:
- Outside Days es un patrón de dos barras.
- Busque un máximo más alto y un mínimo más bajo en el segundo día.
- La barra de precios encaja fuera del rango del día anterior.
- La primera barra no puede tener el precio alto igual al precio bajo o cuatro precios doji (precio de apertura = precio alto = precio bajo = precio de cierre).