Signal Arrows
- Indicadores
- Versión: 1.0
- Activaciones: 10

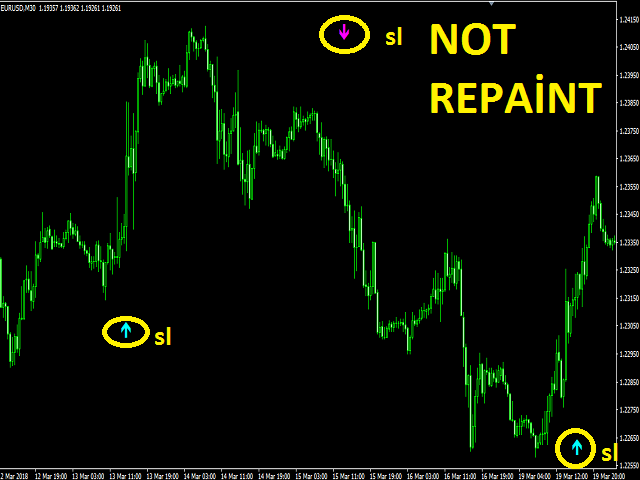
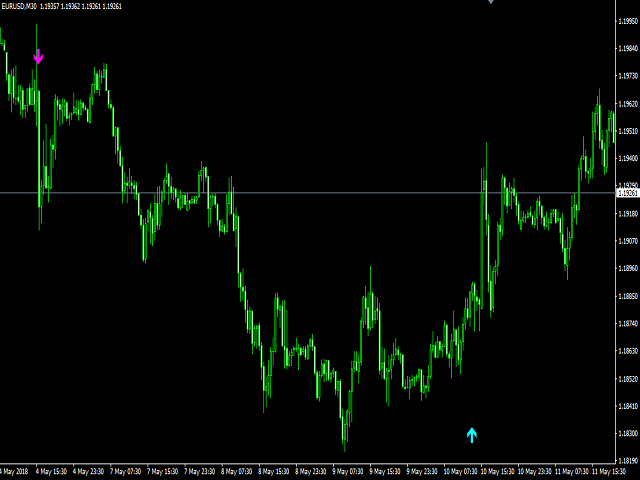
Signal Arrows es un indicador que genera flechas comerciales. Genera flechas de comercio con su propio algoritmo.
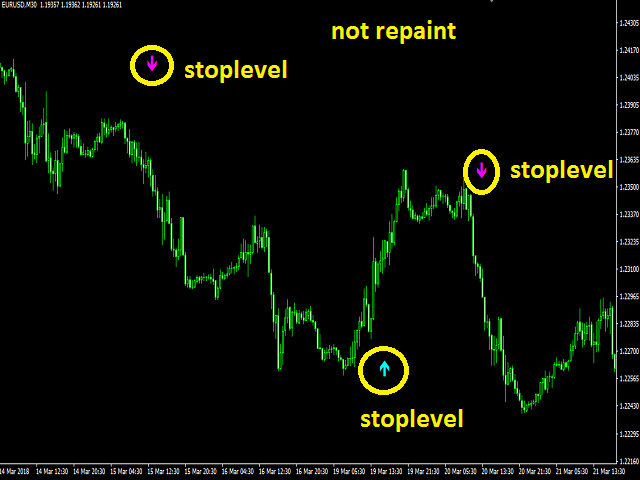
Estas flechas dan señales de compra y venta. Se puede utilizar en todos los pares. Envía una señal al usuario con la función de alerta. El indicador ciertamente no repinta.
Reglas de comercio
- Entre en la señal cuando llegue la señal de compra.
- Para salir de la operación, se debe recibir una señal contraria.
- Es absolutamente necesario cerrar la operación cuando se recibe una señal opuesta.
- Estas reglas deben seguirse en el proceso de venta.
- El nivel de stoploss de las operaciones es la zona donde se encuentran las flechas de señal.
Pares de divisas: Cualquiera
Intervalo de tiempo: M15,M30, H1, H4
Parámetros
- Suscebible - ajuste de la sensibilidad del indicador.
- AlertsOn - envío de alertas. Si esta función está activada, se activará en otras propiedades de alerta.
- AlertsMessage - enviar un mensaje.
- AlertsSound - ajuste de alerta de sonido
- AlertsEmail - ajuste de alertas por correo electrónico. Enviar alertas a la dirección de correo