Universal Main Window MT5
- Indicadores
- Versión: 1.6
- Actualizado: 18 septiembre 2018
- Activaciones: 20

El indicador Universal Main Window MT5 funciona según sus reglas. Basta con introducir una fórmula, a lo largo de la cual se dibujará la línea del indicador.
Este indicador está pensado para su uso en la ventana principal del gráfico.
Todos los indicadores de la serie Universal:
| Ventana principal | Ventana separada | |||||||||
|---|---|---|---|---|---|---|---|---|---|---|
| Gratis |
|
|
||||||||
| Completo |
|
|
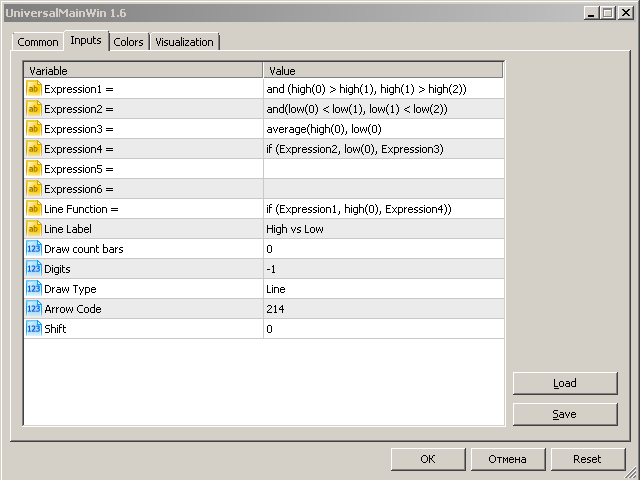
Parámetros de entrada
| Название | Описание |
|---|---|
| Expresión1 = | Campo en el que se puede introducir parte de la fórmula, sustituyendo esta parte en las expresiones posteriores y en la fórmula principal por el nombre del parámetro Expresión1. Parámetro opcional. |
| Expresión2 = | Un campo en el que puede introducir parte de la fórmula, sustituyendo esta parte en las expresiones posteriores y en la fórmula principal con el nombre del parámetro Expression2. Parámetro opcional. |
| Expresión3 = | Un campo en el que puede introducir parte de la fórmula, sustituyendo esta parte en las expresiones posteriores y en la fórmula principal por el nombre del parámetro Expresión3. Parámetro opcional. |
| Expresión4 = | Campo en el que se puede introducir parte de la fórmula, sustituyendo esta parte en las expresiones siguientes y en la fórmula principal por el nombre del parámetro Expresión4. Parámetro opcional. |
| Expresión5 = | Un campo en el que puede introducir parte de la fórmula, sustituyendo esta parte en las expresiones siguientes y en la fórmula principal por el nombre del parámetro Expression5. Parámetro opcional. |
| Expresión6 = | Un campo en el que puede introducir parte de la fórmula, sustituyendo esta parte en la fórmula principal por el nombre del parámetro Expresión6. Parámetro opcional. |
| Línea Función = | Campo en el que se introduce la fórmula. Parámetro obligatorio. |
| Etiqueta de línea | El nombre que se mostrará en la "Ventana de Datos". Parámetro opcional. |
| Recuento de barras | Número de barras para las que se calculará el indicador. Un valor cero o negativo significa todo el gráfico. |
| Dígitos | El número de decimales para los valores del indicador. Un valor negativo indica la precisión de los valores del gráfico actual. |
| Tipo de Dibujo | Seleccione el estilo de dibujo del indicador: línea, segmentos de línea o flechas. |
| Código de flecha | El código de flecha para el estilo de dibujo correspondiente. |
| Desplazamiento | Desplazamiento de la línea del indicador con respecto al gráfico. |
Funciones
El indicador comprueba la corrección de la fórmula introducida y el número de argumentos de las funciones. Si se encuentra un error en la fórmula, aparece la entrada correspondiente en el Registro de Expertos y falla la inicialización.
Si se produce un error aritmético durante el cálculo (división por cero, raíz cuadrada del número negativo), o se intenta consultar datos de precios o indicadores estándar fuera del gráfico, o se introducen argumentos incorrectos en la función de consulta del valor del indicador estándar, entonces el indicador muestra un valor que falta en este punto.
El registro de caracteres en los nombres de las funciones no importa. El número de espacios en la fórmula no importa.
Las partes enteras y fraccionarias en los números se separan por un punto, los argumentos de la función se separan por comas.
Reglas para escribir fórmulas
Se admiten las siguientes operaciones aritméticas:| Notación | Descripción |
|---|---|
| + | Suma |
| - | Resta |
| * | Multiplicación |
| / | División |
| ^ | Exponenciación |
| Notación | Descripción |
|---|---|
| < | Menos |
| > | Más |
| = | Igualmente |
| <= | Menos o igual |
| >= | Más o igual |
| <> | No igual |
Sólo se admiten paréntesis.
Diferencias con la versión gratuita
La diferencia de este indicador respecto a la versión gratuita es el soporte de operaciones de comparación y funciones lógicas, lo que lo convierte en una potente herramienta universal que puede hacer realidad casi cualquier idea del usuario.Funciones
Descripción de las funcionesRangos
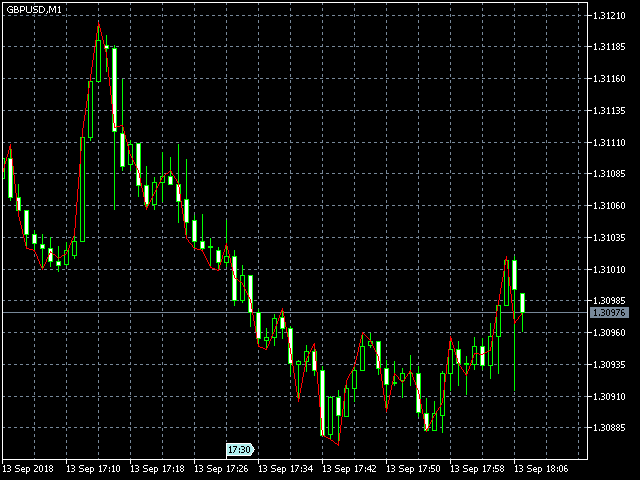
Ejemplo
| Expresión1 = |
and (high(0) > high(1), high(1) > high(2))
|
| Expresión2 = |
and(low(0) < low(1), low(1) < low(2))
|
| Expresión3 = |
average(high(0), low(0)
|
| Expresión4 = |
if (Expression2, low(0), Expression3)
|
| Expresión5 = |
|
| Expresión6 = |
|
| Función de línea = |
if (Expression1, high(0), Expression4))
|
Ejemplos de resolución de problemas