Universal Main Window MT5
- Göstergeler
- Sürüm: 1.6
- Güncellendi: 18 Eylül 2018
- Etkinleştirmeler: 20

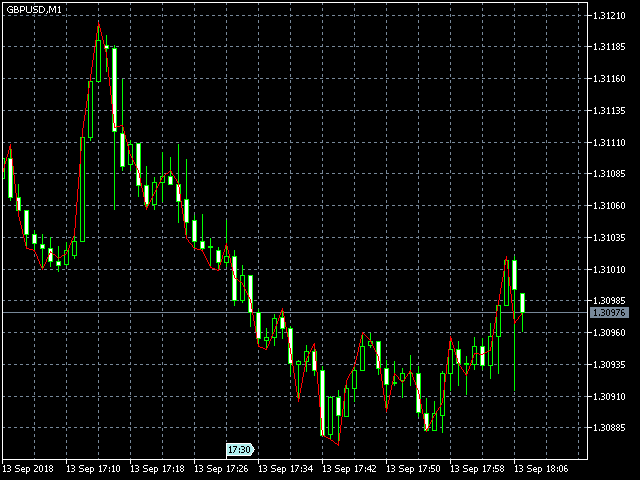
The indicator Universal Main Window MT5 works according to your rules. It is sufficient to introduce a formula, along which the line of the indicator will be drawn.
This indicator is intended for use in the main chart window.
All indicators of the series Universal:
| Main window | Separate window | |||||||||
|---|---|---|---|---|---|---|---|---|---|---|
| Free |
|
|
||||||||
| Full |
|
|
Input parameters
| Название | Описание |
|---|---|
| Expression1 = | A field in which you can enter part of the formula, replacing this part in subsequent expressions and in the main formula with the name of the parameter Expression1. Optional parameter. |
| Expression2 = | A field in which you can enter part of the formula, replacing this part in subsequent expressions and in the main formula with the name of the parameter Expression2. Optional parameter. |
| Expression3 = | A field in which you can enter part of the formula, replacing this part in subsequent expressions and in the main formula with the name of the parameter Expression3. Optional parameter. |
| Expression4 = | A field in which you can enter part of the formula, replacing this part in subsequent expressions and in the main formula with the name of the parameter Expression4. Optional parameter. |
| Expression5 = | A field in which you can enter part of the formula, replacing this part in the following expression and in the main formula with the name of the Expression5 parameter. Optional parameter. |
| Expression6 = | A field in which you can enter part of the formula, replacing this part in the main formula with the name of the parameter Expression6. Optional parameter. |
| Line Function = | The field in which you want to enter your formula. Required parameter. |
| Line Label | The name that will be displayed in the "Data Window". Optional parameter. |
| Draw count bars | The number of bars for which the indicator will be calculated. A zero or a negative value means the whole chart. |
| Digits | The number of decimal places for the indicator values. A negative value indicates the accuracy of the values of the current chart. |
| Draw Type | Select the style of drawing the indicator: line, line segments or arrows. |
| Arrow Code | The arrow code for the corresponding drawing style. |
| Shift | Shift of the indicator line relative to the chart. |
Features
The indicator checks the correctness of the entered formula and the number of arguments in the functions. If an error is found in the formula, the corresponding entry appears in the Expert Log, and the initialization fails.
If an arithmetic error occurs during the calculation (division by zero, the square root of the negative number), or an attempt is made to query price data or standard indicators outside the graph, or incorrect arguments are entered in the function of querying the value of the standard indicator, then the indicator shows a missing value at this point.
The character register in the function names does not matter. The number of spaces in the formula does not matter.
The integer and fractional parts in numbers are separated by a period, the function arguments are separated by commas.
Rules for writing formulas
The following arithmetic operations are supported:| Notation | Description |
|---|---|
| + | Addition |
| - | Subtraction |
| * | Multiplication |
| / | Division |
| ^ | Exponentiation |
| Notation | Description |
|---|---|
| < | Less |
| > | More |
| = | Equally |
| <= | Less or equal |
| >= | More or equal |
| <> | Not equal |
Only parentheses are supported.
Differences from the free version
The difference of this indicator from the free version is the support of comparison operations and logical functions, which turns it into a powerful universal tool that can realize almost any idea of the user.Functions
Description of functionsRanges
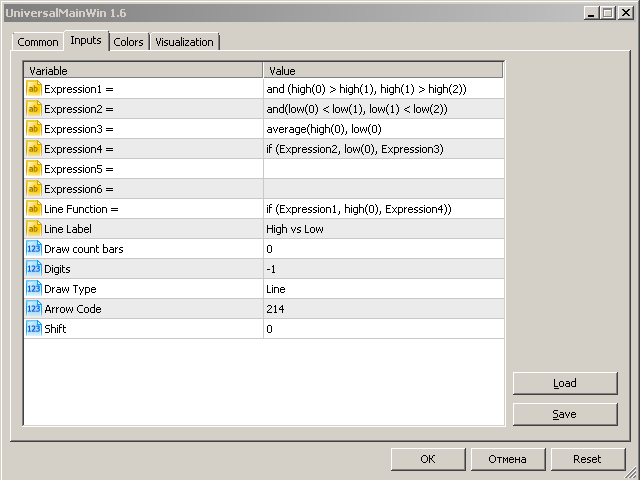
Example
| Expression1 = |
and (high(0) > high(1), high(1) > high(2))
|
| Expression2 = |
and(low(0) < low(1), low(1) < low(2))
|
| Expression3 = |
average(high(0), low(0)
|
| Expression4 = |
if (Expression2, low(0), Expression3)
|
| Expression5 = |
|
| Expression6 = |
|
| Line Function = |
if (Expression1, high(0), Expression4))
|
Examples of problem solving