IntraDayTrack MT5
- Indicadores
- Versión: 2.3
- Actualizado: 23 agosto 2018
- Activaciones: 5

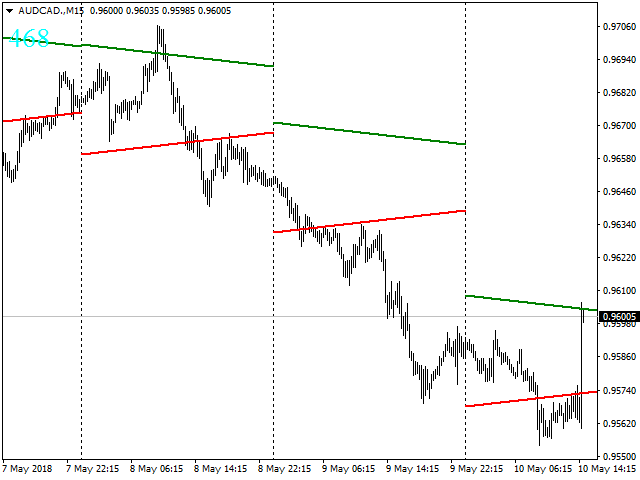
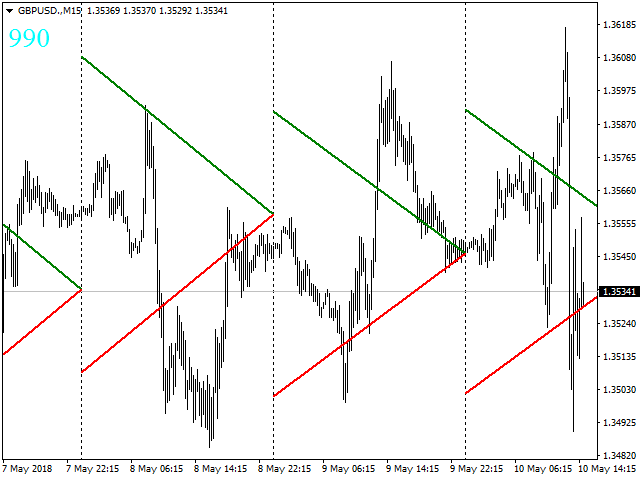
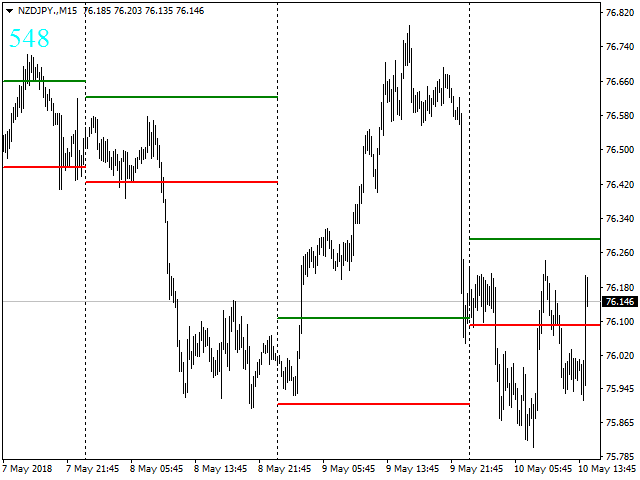
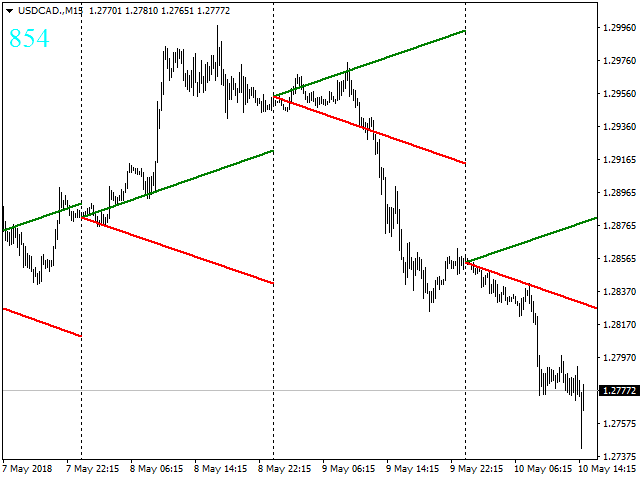
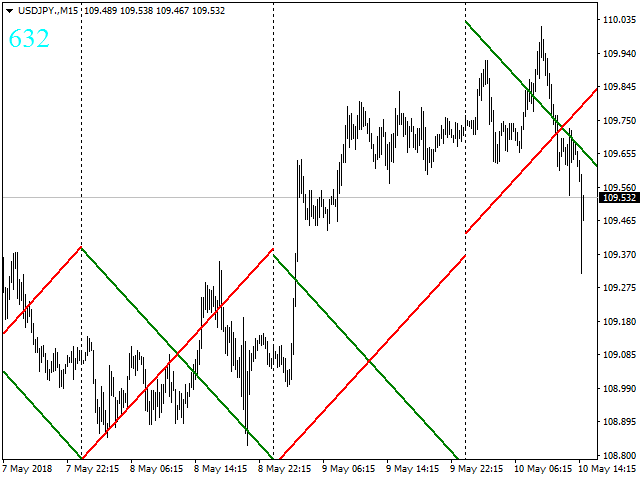
IntradayTrack muestra en el gráfico de precios las líneas de soporte y resistencia diarias basadas en los instrumentos de volatilidad media para un periodo determinado. En el indicador, es posible inclinar la línea a un ángulo determinado tanto al principio del día de negociación como al final del período de negociación.
Parámetros
- Período de seguimiento - período de trazado de las líneas (día, semana, mes)
- Rango de precio medio - número de días para los que se considera la volatilidad media
- Valor inicial (Avg%) - distancia entre las líneas al comienzo de un día de negociación en % de la volatilidad media para un período seleccionado
- Valor final (Avg%) - distancia entre las líneas al final de un día de negociación en % de la volatilidad media para un período seleccionado.
- Historial - número de los últimos días para los que se muestra el indicador