Growth and Balance indicator
- Indicadores
-
Roman Starostin
 Hi! I am a Forex trader with over 12 years of experience. Mostly I am engaged in the study of new methods of trading in the foreign exchange market, as well as programming expert advisors and indicators.
 - Versión: 1.64
- Actualizado: 23 abril 2021
- Activaciones: 20
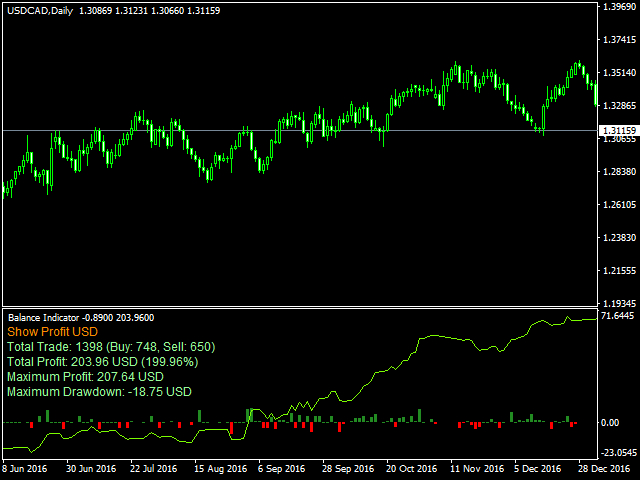
Indicador de Crecimiento y Balance diseñado para mostrar visualmente los resultados de las operaciones del usuario directamente en la terminal MT4 sin necesidad de utilizar servicios y programas externos.
Después de un largo análisis, llegué a la conclusión de que los recursos en línea para el cálculo de la reducción de las cuentas comerciales no pueden mostrar de forma fiable la equidad que realmente estaba en la cuenta traiding en el período antes de que el sistema se conecta a estos recursos, por lo tanto, los datos para el cálculo de ingresos / reducción no se muestra correctamente. El indicador de Crecimiento y Balance analiza los gráficos de su broker y su, mira los precios de Cierre, Máximo y Mínimo de todas las barras para los pares de operaciones y muestra la equidad con el mínimo error.
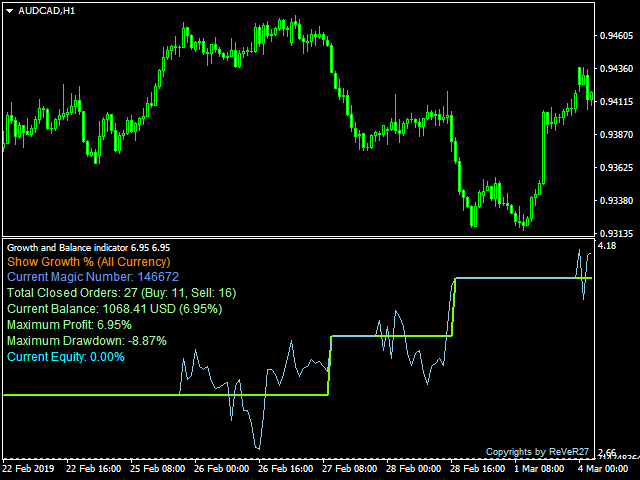
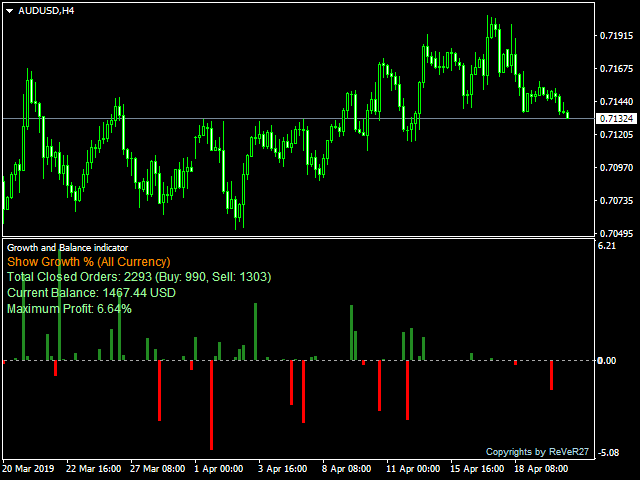
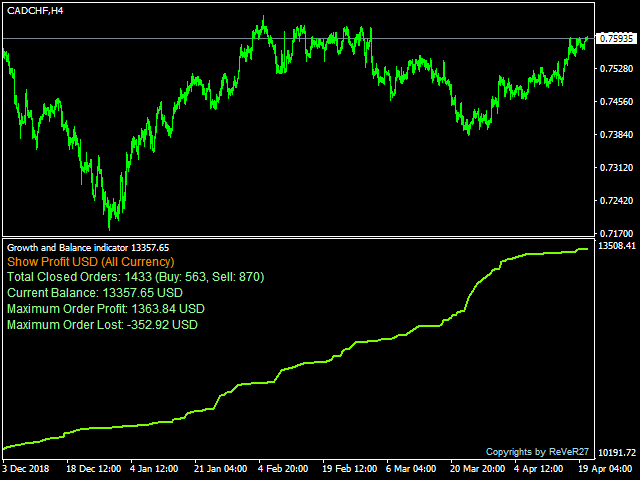
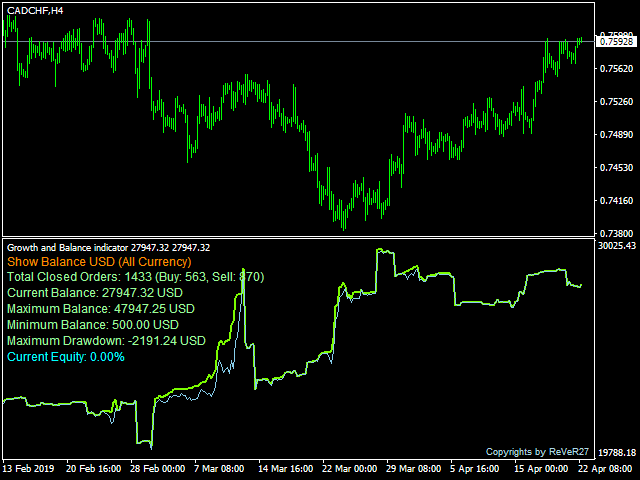
Este indicador es conveniente para analizar su sistema de comercio, la búsqueda de sus defectos y puntos fuertes. El programa le permite ver los resultados de las operaciones de todas las órdenes en el historial, así como de símbolos específicos, la dirección de compra o venta de las órdenes cerradas, así como el Número Mágico individual. El indicador muestra la información como una línea en el gráfico y un histograma en cualquier marco de tiempo, muestra el saldo y la equidad de la cuenta de operaciones. Dispone de tres modos: Porcentaje de ingresos, Saldo de la cuenta u Órdenes de beneficios.
Configuración
Elija el tipo de indicador
- Tipo de Indicador - 3 tipos de modos de visualización de la información:
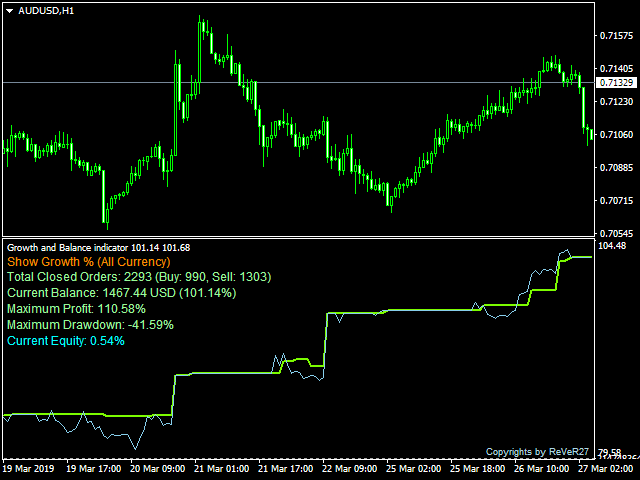
- CRECIMIENTO % - resultados de operaciones mostrados como porcentaje % del saldo.
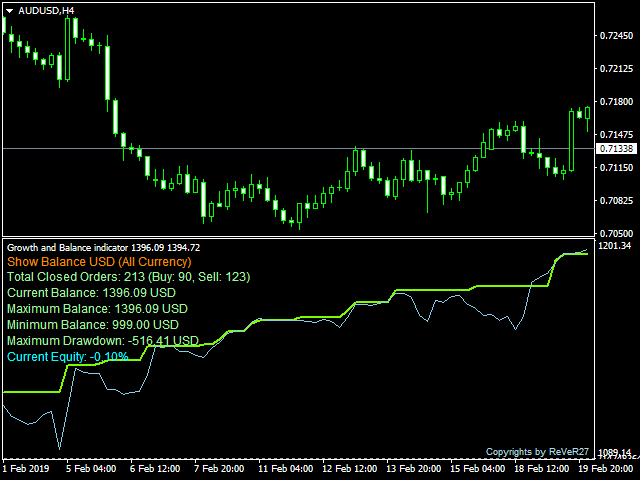
- SALDO - muestra el saldo de los resultados de negociación y las operaciones de depósito/retirada en moneda de negociación.
- PROFIT - gráfico de ganancias/pérdidas por barra en moneda de negociación.
- Min Period Count Equity - periodo de tiempo en el que se calculará la Equidad. Cuanto menor sea el período, más precisos serán los datos de cálculo, pero el número de barras de historial cargadas para cada par debe ser mayor. (Si usted tiene más de 2 años de historia comercial, se recomienda establecer el ТF Н1/Н4)
Ajustes generales/filtros
- Mostrar Divisa - TODAS o Divisa Actual (la divisa del gráfico actual)
- Mostrar Tipo de Orden - dirección de las órdenes: TODO, Sólo Compra, Sólo Venta.
- Magic Number Filter - si el parámetro es igual a "ALL Magic" o un valor vacío, todas las órdenes serán analizadas. Puede establecer números mágicos particulares separados por una coma (,) para un análisis más detallado.
Configuración del indicador de pantalla
- MostrarLínea Principal - mostrar la línea principal de los resultados de las operaciones para diferentes tipos de gráficos.
- Mostrar Línea deEquidad - muestra la línea de equidad en el gráfico. No funciona en el modo PROFIT.
- Show Histogram - muestra histogramas de ganancias/retrocesos de la cuenta. Para una visualización más detallada del histograma, se recomienda utilizarlo sin los parámetros Show Main Line y Show Equity Line.
- Show Text Label - mostrar texto informativo en la esquina izquierda de la ventana del indicador.
Parámetros de Alerta
- Alerta y E-mail cuando se alcanza el DD% - envía un e-mail y muestra una alerta en el gráfico cuando se alcanza la reducción. 0 - desactivado.
Otros ajustes
- Write Equity to File - escribir valores de equidad a un archivo para cargar el historial más tarde después de la reinicialización del indicador o la reapertura de la terminal. Escritura cada 5 minutos. Esta función proporcionará mejores resultados que el analizador histórico.
Nota
- Antes de utilizar el indicador, conecte su cuenta de operaciones con el terminal (también en el modo de prueba).
- En las pruebas visuales, la fecha no debe ser anterior a la hora real de inicio de las operaciones en la cuenta.
- Todo el historial disponible debe mostrarse en la ventana "Historial de la cuenta" (botón derecho del ratón - "Todo el historial").
- Dado que MetaTrader4 no tiene la capacidad de cargar programáticamente el historial de cotizaciones que falta, para calcular correctamente la Equidad, debe desplazarse manualmente a través de los gráficos para todos los Símbolos que utilizó en el comercio, de lo contrario la línea de Equidad no se mostrará correctamente. Si falta historial, el indicador escribirá el mensaje "Barras de historial no se cargaron completamente" en Diario e indicará la fecha de inicio necesaria.
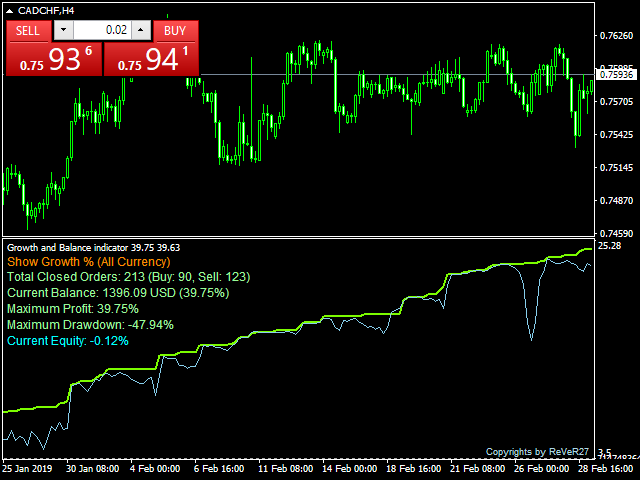

I'm very impressed with this indicator. It does an outstanding job of showing something that is hard to find - Maximum DD. I hightly recommend it.