Growth and Balance indicator
- 지표
-
Roman Starostin
 Hi! I am a Forex trader with over 12 years of experience. Mostly I am engaged in the study of new methods of trading in the foreign exchange market, as well as programming expert advisors and indicators.
 - 버전: 1.64
- 업데이트됨: 23 4월 2021
- 활성화: 20
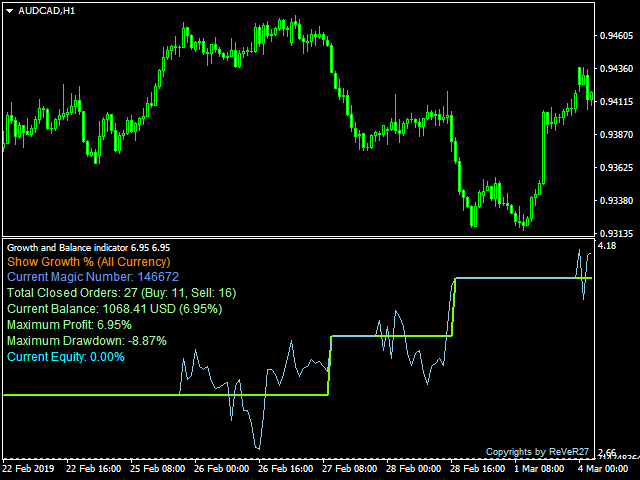
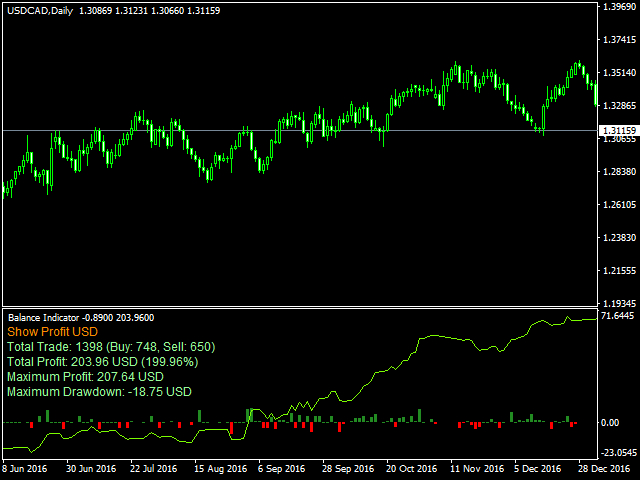
Growth and Balance indicator designed to visually display the results of user's trading directly in the MT4 terminal without using external services and programs.
After a long analysis, I came to conclusion that online resources for calculating the drawdown of trading accounts cannot reliably display the Equity that really was on traiding account in period before the system connect to these resources, therefore, the data for calculating income / drawdown isn't displayed correctly. Growth and Balance indicator analyzes charts of your broker and your, looks at the Close, High and Low prices of all bars for trading pairs and displays equity with the minimum error.
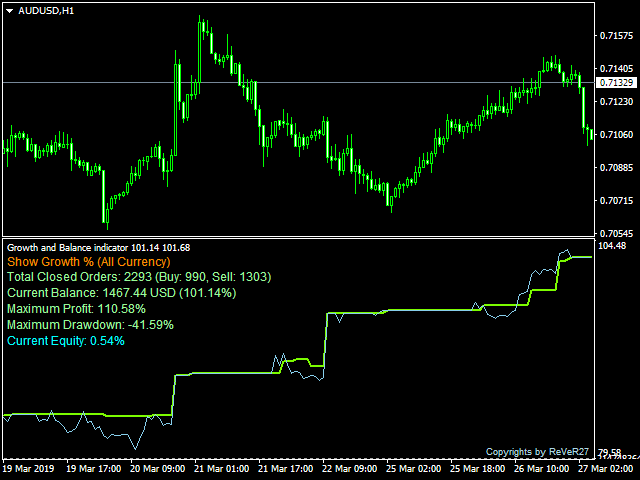
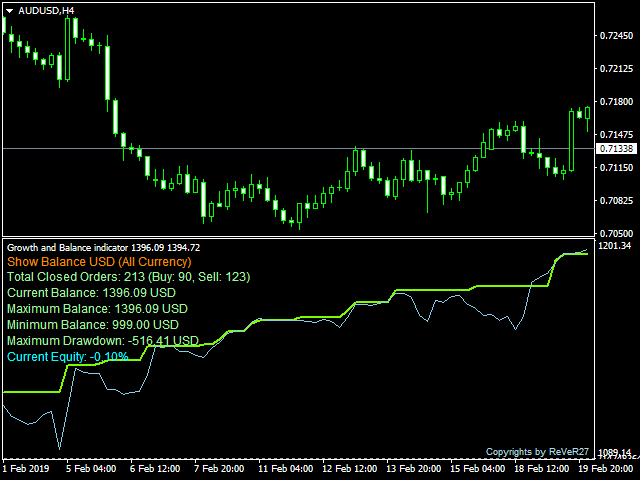
This indicator is convenient for analyzing your trading system, searching for its flaws and strong points. The program allows you to view trading results for all orders in history, as well as for specific symbols, buy or sell direction of closed orders, as well as the individual Magic Number. The indicator displays information as a line on chart and a histogram on any timeframe, shows balance and equity of the trading account. It has three modes: Percentage of income, Account balance or Profit orders.
Settings
Choose Indicator Type
- Indicator Type - 3 types information display modes:
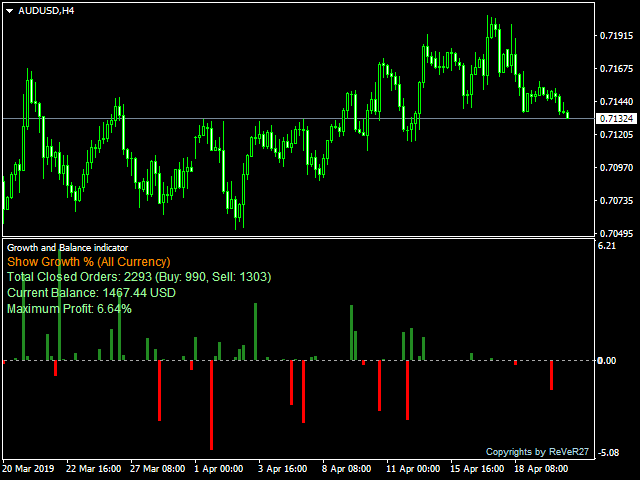
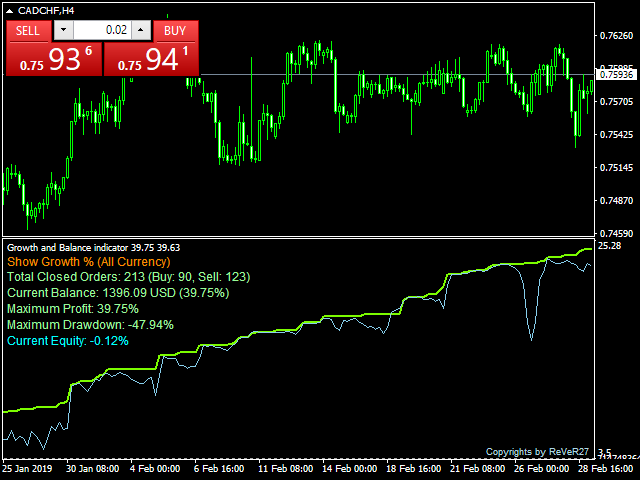
- GROWTH % - trading results shown as percentage % of balance.
- BALANCE - showing balance of trading results and deposit/withdrawal operations in trading currency.
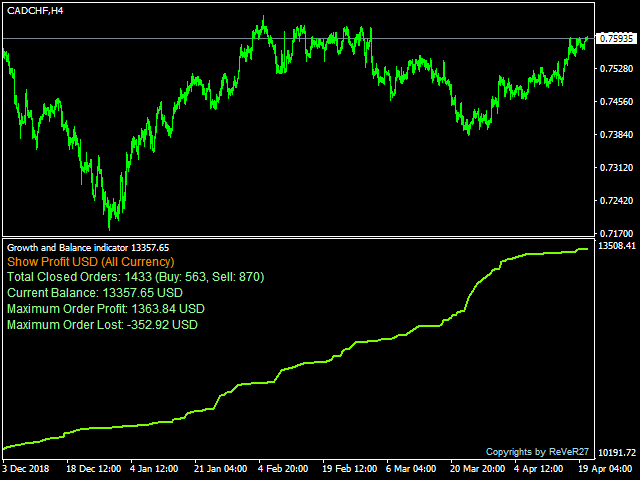
- PROFIT - graph of profit/loss per bar in trading currency.
- Min Period Count Equity - timeframe where Equity will be calculated. The smaller period, the more accurate the calculation data will be, but the number of loaded history bars for each pair should be greater. (If you have more than 2 years trading history, recommended to set the ТF Н1/Н4)
General settings/filters
- Show Currency - ALL or Current Currency (the currency of the current chart)
- Show Order Type - direction of orders: ALL, Only Buy, Only Sell.
- Magic Number Filter - if parameter equal "ALL Magic" or an empty value, all orders will be analyzed. You can set particular magic numbers separated by a comma (,) for a more detailed analysis.
Display Indicator settings
- Show Main Line - display the main line of trading results for different chart types.
- Show Equity Line - display Equity line on chart. Don't work at PROFIT mode.
- Show Histogram - display histograms of account profit/drawdown. For more detailed display of the histogram, it is recommended to use it without Show Main Line and Show Equity Line parameters.
- Show Text Label - show information text in the left corner of the indicator window.
Alert settings
- Alert and E-mail when DD% reached - send e-mail and display alert on chart when the drawdown will be reached. 0 - off.
Other settings
- Write Equity to File - writing equity values to a file to upload history later after indicator re-initialization or terminal re-open. Writing every 5 minuts. This function will provide better equity display result then history analyzer.
Note
- Before using the indicator, connect your trading account with the terminal (also in the testing mode).
- When visual testing, the date must be specified not earlier than the actual time when trading on the account started.
- The entire available history must be shown in the "Account history" window (right click - "All History").
- Since MetaTrader4 does not have the ability to programmatically load the missing history of quotes, to correctly calculate the Equity, you must manually scroll through the charts for all the Symbols you used in trading, otherwise the Equity line won't displayed correctly. If there is a shortage of history, the indicator will write the message "History bars did not load completely" in Journal and indicate the necessary starting date.
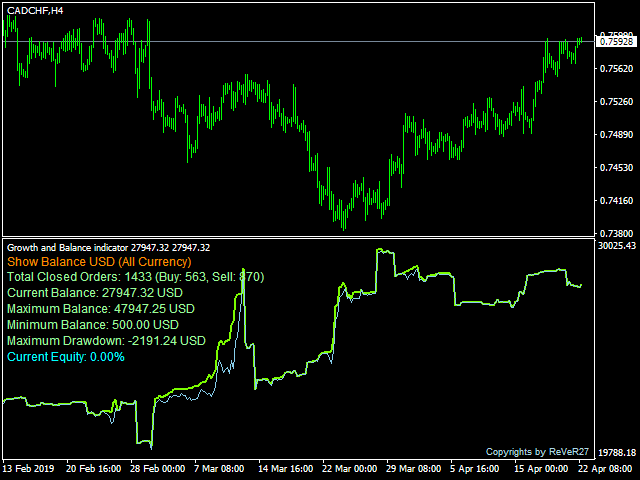

I'm very impressed with this indicator. It does an outstanding job of showing something that is hard to find - Maximum DD. I hightly recommend it.