BW Alligator
- Indicadores
- Versión: 1.15
- Activaciones: 6
Una versión mejorada del clásico indicador Alligator de Bill Williams.
Descripción
El indicador técnico Alligator es una combinación de medias móviles (líneas de equilibrio).
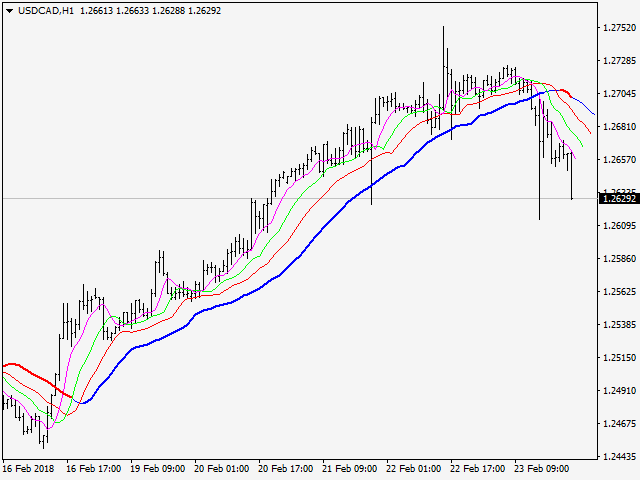
- La línea azul (Alligator Jaw) es una media móvil suavizada de 13 periodos, desplazada 8 barras hacia el futuro;
- Lalínea roja (Dientes de cocodrilo) es una media móvil suavizada de 8 periodos, desplazada 5 barras hacia el futuro;
- Lalínea verde (Labios de cocodrilo) es una media móvil suavizada de 5 periodos, desplazada 3 barras hacia el futuro;
- Lalínea morada (Fast Gator) es una media móvil suavizada de 3 periodos, desplazada 1 barra hacia el futuro.
Los labios, los dientes y las mandíbulas del caimán ilustran la interacción de distintos periodos. Dado que las tendencias del mercado sólo pueden identificarse durante un 15-30 por ciento del tiempo, debemos seguir las tendencias, y no trabajar en mercados que fluctúan sólo dentro de ciertos periodos de precios.
Para trazar estas medias móviles se utiliza el precio medio.
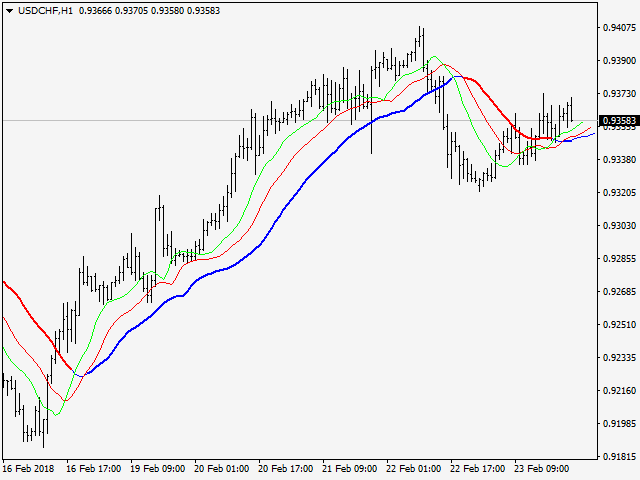
Se dice que el caimán está durmiendo cuando las líneas del indicador se cruzan entre sí. Cuanto más tiempo duerme, más hambre tiene.
En otras palabras, una intersección a largo plazo de medias móviles es el periodo de consolidación de precios.
Cuando el caimán duerme, ocurren cosas "interesantes": se despierta y empieza a bostezar, abriendo la boca. Tras oler a su presa (toro u oso), empieza a cazar. Cuando el hambre del caimán se sacia, el interés por la comida disminuye, y las líneas del indicador vuelven a entrelazarse (es el momento de fijar el beneficio).
En términos de análisis técnico, se trata de una ruptura del rango de negociación, cuya fuerza depende de la duración de la consolidación.
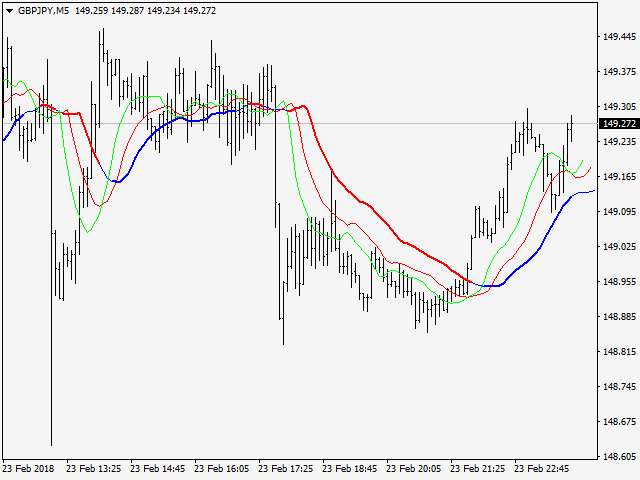
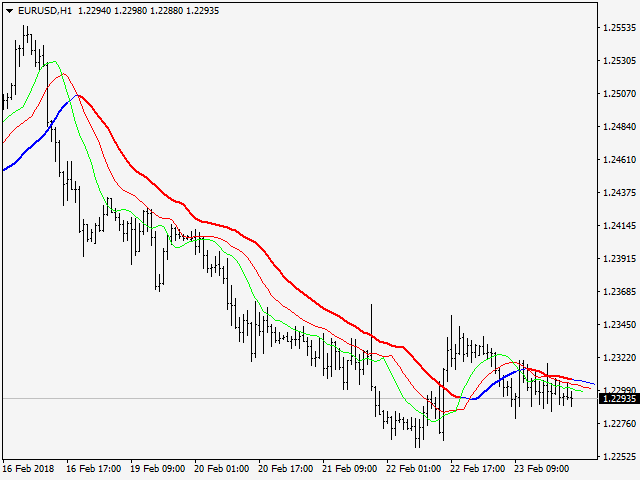
Durante una tendencia bajista, la línea azul (Alligator Jaw) cambia su color a rojo (puede cambiarse en los ajustes), lo que permite identificar visualmente la dirección actual del movimiento del precio.
Es posible visualizar antes los cambios de tendencia cuando se opera en plazos inferiores (M1-M30). En este caso, se utiliza la intersección de Fast Gator (línea morada) y Alligator Lips (línea verde) en contraste con la versión clásica - intersección de Alligator Lips (línea verde) y Alligator Teeth (línea roja) con Alligator Jaw (línea azul).
El indicador Alligator se utiliza para determinar la tendencia, así como en conjunción con otros indicadores de Bill Williams, como Awesome Oscillator, Accelerator Oscillator y Fractal.
Parámetros del indicador
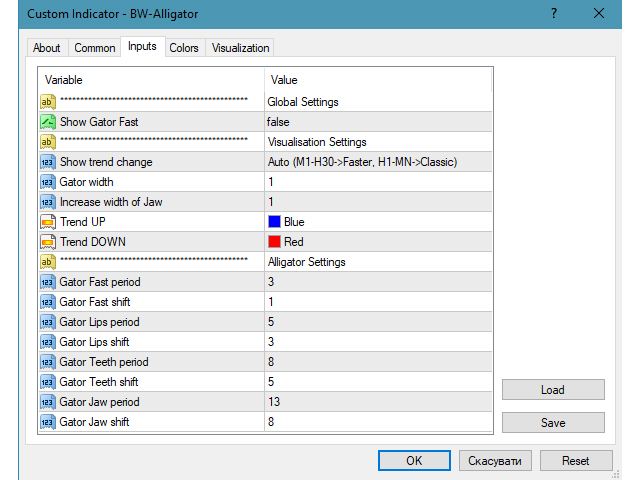
- Parámetros globales
- Mostrar Gator Rápido - mostrar Gator Rápido
- verdadero
- falso;
- Parámetros de visualización
- Mostrar cambio de tendencia - mostrar los cambios de tendencia
- Auto (M1-H30->Más rápido, H1-MN->Clásico).
- Faster - intersección de Fast Gator y Alligator Lips con Alligator Jaw.
- Clásico - intersección de Labios de cocodrilo y Dientes de cocodrilo con Mandíbula de cocodrilo.
- none - no se muestran los cambios de tendencia.
- Gator width - grosor de las líneas de Alligator.
- Aumentar ancho de la mandíbula - aumenta el grosor de la línea de la mandíbula del Alligator con respecto a las demás líneas del Alligator.
- TendenciaARRIBA - color de la línea Alligator Jaw durante una tendencia alcista (por defecto es azul).
- TendenciaABAJO - color de la línea Alligator Jaw durante una tendencia bajista (por defecto es rojo).
- Alligator Settings - Ajustes de la media móvil
- Periodo Gator Rápido - periodo de suavizado de la línea Gator Rápido (3).
- GatorFast shift - desplazamiento de la línea Fast Gator (1).
- Periodo GatorLips - periodo de suavizado de la línea Alligator Lips (5).
- Gator L ipsshift - desplazamiento de la línea Alligator Lips (3).
- Periodo Dientes de Cocodrilo - periodo de suavizado de la línea Dientes de Cocodrilo (8).
- Gator Teeth shift - desplazamiento de la línea Alligator Teeth (5).
- Gator Jaw period - periodo de suavizado de la línea Alligator Jaw (13).
- Gator Ja w shift - desplazamiento de la línea Alligator Jaw (8).
¡Feliz negociación!