TSO Top Bottom Divergence Momentum MT5
- Indicadores
-
Dionisis Nikolopoulos
 We are a small team of individuals with a strong passion for trading.
Our research is focused in the area of trading methods and mechanical trading systems
developed on the MT4 and MT5 trading platforms.
Many more features will be coming in the future, so stay with us! - Versión: 1.32
- Actualizado: 13 mayo 2019
- Activaciones: 10
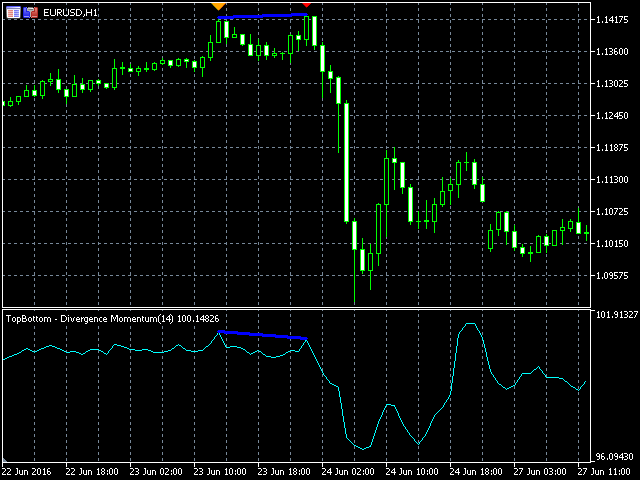
Este indicador combina patrones gráficos de inversión de doble fondo y doble techo junto con la detección de divergencias entre el gráfico de precios y el oscilador Momentum.
Características
- Detecta fácilmente fuertes señales de inversión
- Permite utilizar señales de doble fondo/doble techo y divergencia Momentum combinadas o de forma independiente
- Recibe alertas por correo electrónico y/o notificaciones push cuando se detecta una señal
- Se pueden utilizar colores personalizados
- El indicador no se repinta
- Se puede utilizar fácilmente en un EA (ver más abajo)
Entradas
- HABILITAR Doble Superior - Inferior: Habilita el indicador doble top - bottom.
- ENABLE Show Double Top - Bottom Potential: Muestra el potencial del doble máximo y mínimo antes de que suceda (función de repintado).
- Habilitar Divergencia: Habilita el indicador de divergencia de Momentum.
- Period: Establece el periodo del oscilador Momentum.
- Precio Aplicado: El precio de la vela que se utilizará para los cálculos de Momentum.
- Relación entre Double Top-Bottom y Momentum Divergence:
- Combinada: Se muestran todas las señales Double Top - Bottom pero sólo se muestran las señales Momentum Divergence que se corresponden con las señales Double Top - Bottom. Ambos indicadores, Doble Top - Bottom y Momentum Divergence deben estar activados.
- Independiente: Cada indicador presenta sus señales de forma independiente.
- Número de Barras (Número Impar) [Afecta sólo a la Divergencia]: Este es el número de barras que se requieren para detectar un precio alto o bajo, incluyendo la barra superior/inferior. Por ejemplo, si se establece en 5, los ALTOS de precios se detectarán en las barras que tengan un ALTO superior al ALTO de las dos primeras barras a su izquierda y derecha. Si la Divergencia de Momento se utiliza de forma independiente, utiliza este mecanismo para detectar máximos y mínimos. De lo contrario, los máximos y mínimos se detectan a través del indicador Doble techo/fondo.
- Configuración de colores: Configure los colores para los objetos mostrados en el gráfico.
- HABILITAR Alerta deDivergencias: Recibe una alerta cuando se detecta una divergencia.
- HABILITAR Alerta de Doble Techo- Fondo: Recibe una alerta cuando se detecta un doble techo/fondo.
- HABILITAR AlertaMetatrader: Recibe una alerta en la plataforma MetaTrader.
- HABILITAR Alertapor email: Recibe una alerta en tu email.
- HABILITAR Notificación Push: Recibe una notificación push en tu móvil.
Para desarrolladores de EA
- Valor de Momentum: Buffer = 0
- Señal de Divergencia: Buffer = 1
- Compra=0
- Vender=1
- Primer valor Bottom: Buffer = 2
- Segundo valor mínimo: Buffer = 3
- Primer valor Top: Buffer = 4
- Segundo valor Superior: Buffer = 5
- Señal superior/inferior: Buffer = 6
- Compra=0
- Vender=1