Master Phi
- Indicadores
-
Chantal Sala
 Hi, I'm a programmer (female) from 1995 and in MQL4 from 2008.
I have released most of 2500 Expert Advisor/Indicators and Dashboard.
I have worked with many famous italian traders to automate their strategy. - Versión: 1.0
- Activaciones: 10
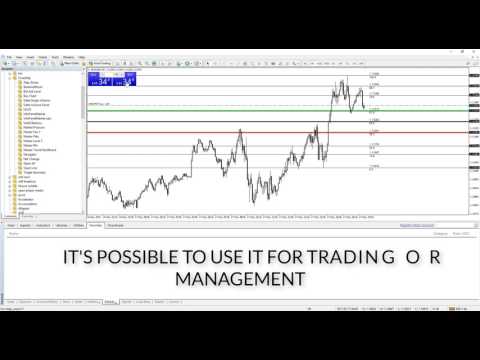
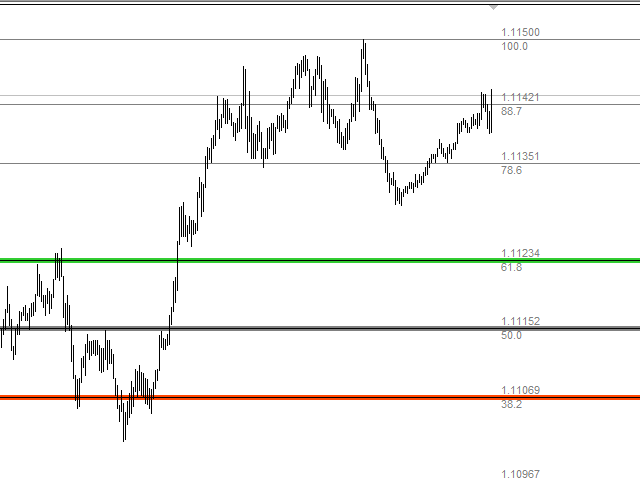
Master Phi es un indicador basado en los números de Fibonacci.
Analiza los valores porcentuales devolviendo la proporción de la Sección Aurea.
Puede personalizar los valores y establecer niveles personalizados por lo que creará su Trading personal.
La atención en los mínimos y los máximos de los marcos de tiempo permite un análisis preciso con el fin de interceptar con mucha precisión los niveles de negociación después de los diversos movimientos de impulso.
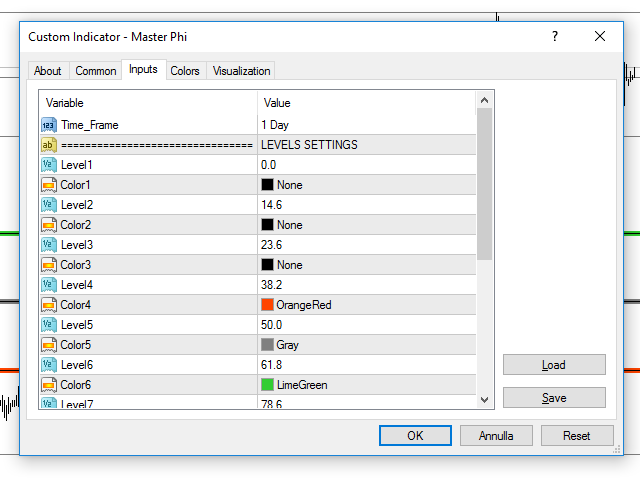
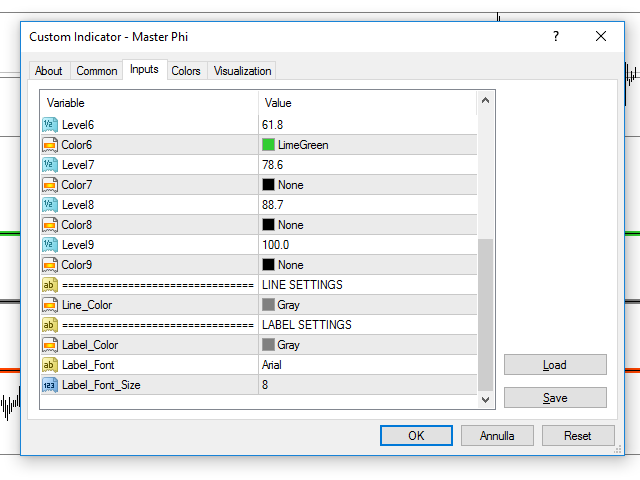
Valores de entrada
- Marco_temporal a analizar
- CONFIGURACIÓN DE NIVELES
- 9 niveles (en porcentaje)
- 9 colores
- CONFIGURACIÓN DE LÍNEA
- Color_de_línea
- LABEL SETTINGS (ajustes de texto)
- Color_etiqueta
- Fuente_etiqueta
- Label_Font_Size