YFX Symbol Data
- Indicadores
-
Richard Yancy
 Independent FX trader
 - Versión: 6.0
- Actualizado: 12 junio 2020
- Activaciones: 5
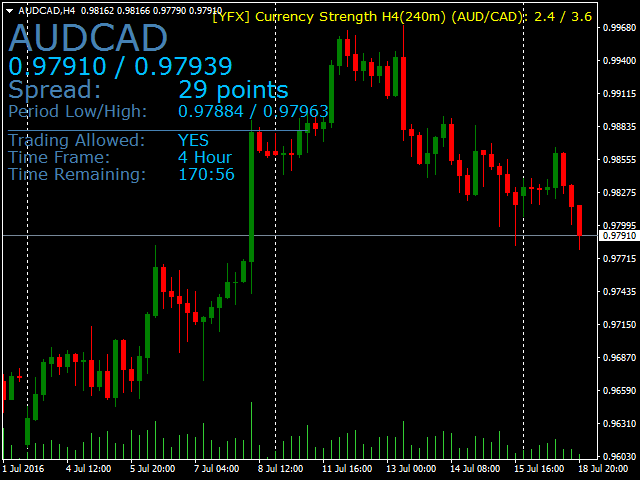
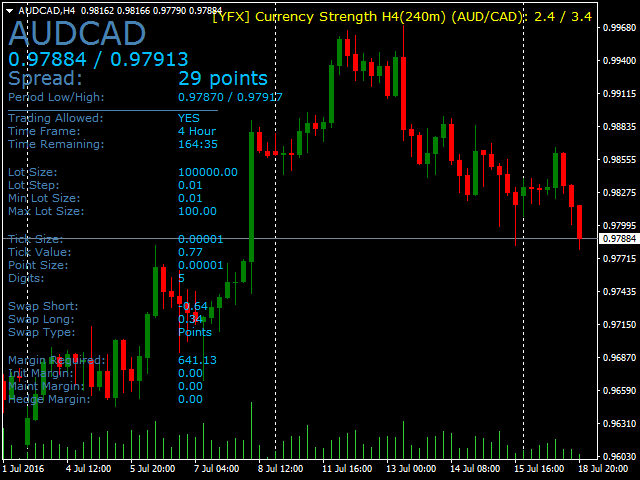
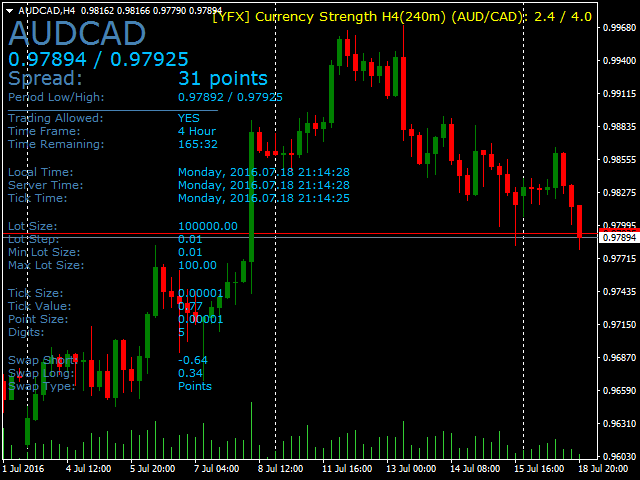
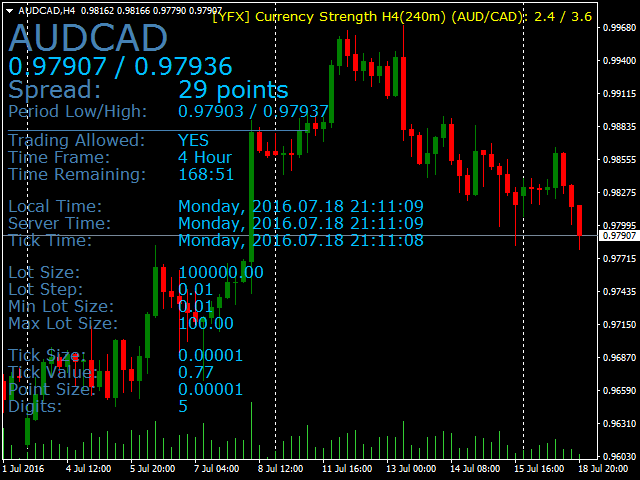
El indicador YFX Symbol Data se utiliza para mostrar toda la información sobre el símbolo del gráfico actual. El indicador facilita el examen de mucha más información que el simple precio de compra/venta. La información se clasifica de la siguiente manera:
- Información básica - La información más genérica sobre un símbolo. Incluye el nombre del símbolo, los precios de compra/venta y los datos del spread. También incluye el precio mínimo y máximo alcanzado durante el periodo actual.
- Información del marco temporal - Más detalles sobre el marco temporal actual que se está utilizando en el gráfico.
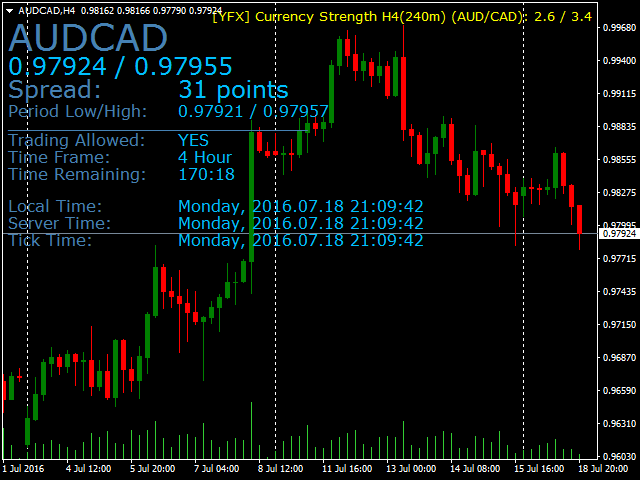
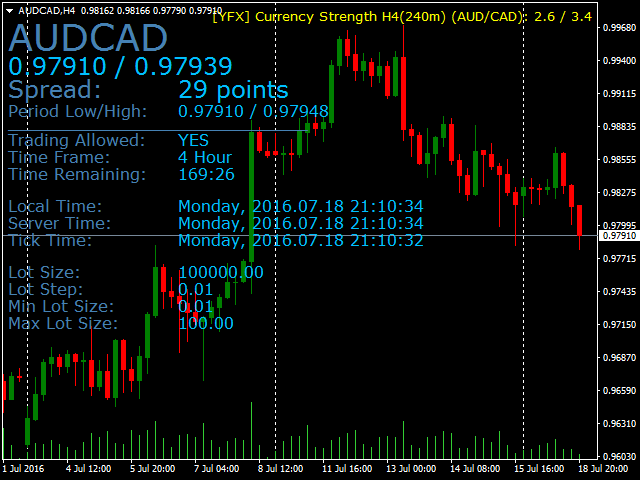
- Información de Fecha/Hora - Se muestran diferentes fechas y horas para varios elementos.
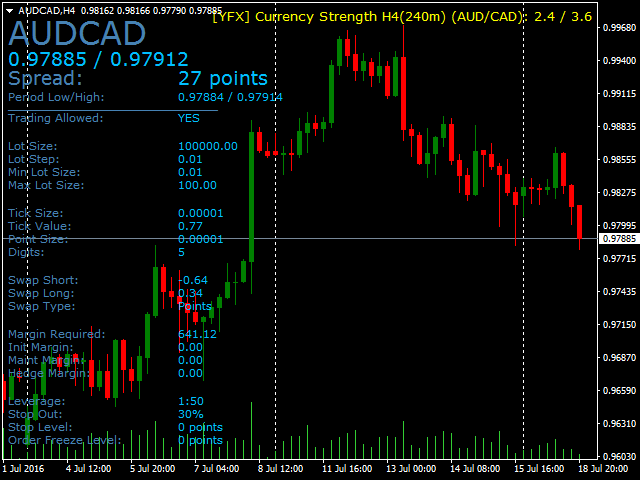
- Informacióndel Lote - Todos los datos del lote proporcionados por el broker para el símbolo actual.
- Información deTicks - Todos los detalles sobre los ticks para el símbolo actual del gráfico.
- Información sobre swaps - Muchos operadores conocen los swaps y los tipos de interés, pero no muchos pueden explicar exactamente cómo se calculan los tipos para una divisa específica. Este indicador elimina todas las conjeturas y muestra toda la información del swap. Muestra el precio de vender un lote del símbolo actual. También muestra el precio de mantener un lote largo. También muestra el método de cálculo de swap utilizado por el broker.
- Información sobremárgenes: se muestra toda la información relacionada con los márgenes para el símbolo.
- Información de apalancamiento - Cantidad de apalancamiento ofrecida por el broker.
- Otra información - Cualquier otra información conocida sobre el símbolo actual.
Toda la información puede mostrarse en el gráfico para que pueda leerse fácilmente. El indicador también tiene parámetros que se pueden configurar para personalizar la información que se muestra. Tenga en cuenta también que las categorías no son mutuamente excluyentes. La información puede ser aplicable a múltiples categorías pero sólo se mostrará en una sección por simplicidad.
Parámetros de entrada del indicador
El indicador de datos de símbolos tiene muchos parámetros que pueden utilizarse para personalizar la experiencia. Los parámetros se clasifican de la siguiente manera:
- YFX_SDAT_INDICATOR - Sección de parámetros que controlan el comportamiento del indicador.
- YFX_SDAT_DISPLAY - Sección de parámetros que controlan la información que se muestra en el gráfico.
- YFX_SDAT_GUI - Sección de parámetros que controlan cómo se muestra el indicador en el gráfico.
- YFX_SDAT_FONT - Sección de parámetros que permite cambiar las fuentes, lo que incluye el tipo de fuente, el nombre y el tamaño.
- YFX_SDAT_COLOR - Sección de parámetros que controlan los colores utilizados para mostrar la información en el gráfico.
Todos los parámetros están asignados a valores por defecto que deberían estar bien en la mayoría de los casos. Se aconseja no cambiar los valores hasta que uno se familiarice con el indicador. Entonces se pueden probar parámetros específicos para verificar qué funciones del indicador se ven afectadas por qué parámetros.