YFX Symbol Data
- Indikatoren
-
Richard Yancy
 Independent FX trader
 - Version: 6.0
- Aktualisiert: 12 Juni 2020
- Aktivierungen: 5
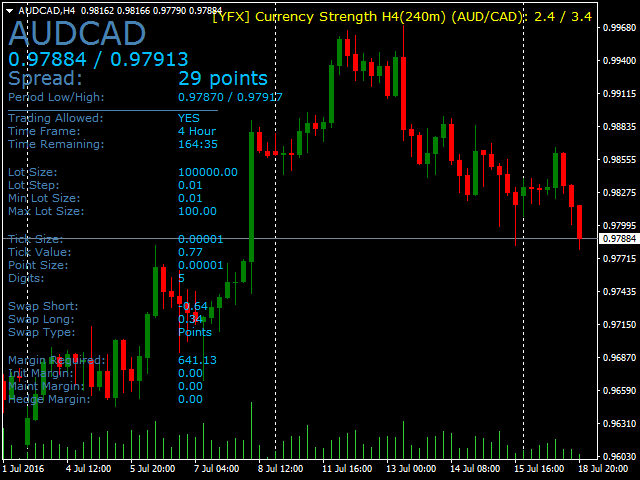
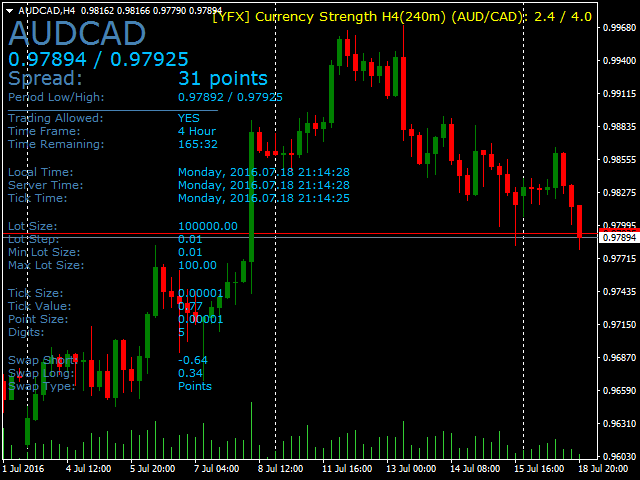
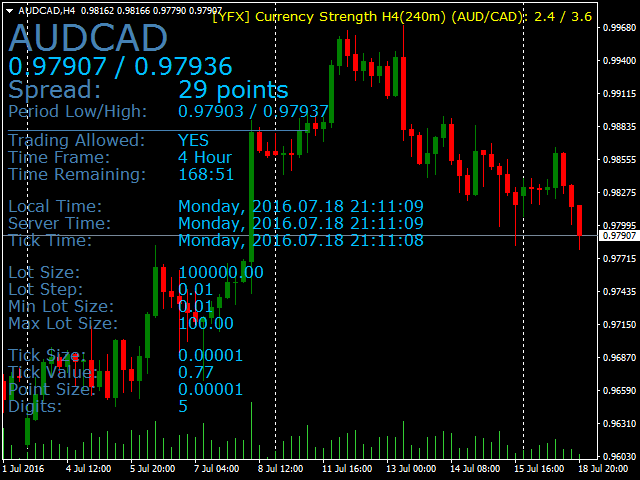
Der YFX Symbol Data Indikator wird verwendet, um alle Informationen über das aktuelle Chartsymbol anzuzeigen. Der Indikator macht es einfach, viel mehr Informationen als nur den Geld-/Briefkurs zu untersuchen. Die Informationen sind wie folgt kategorisiert:
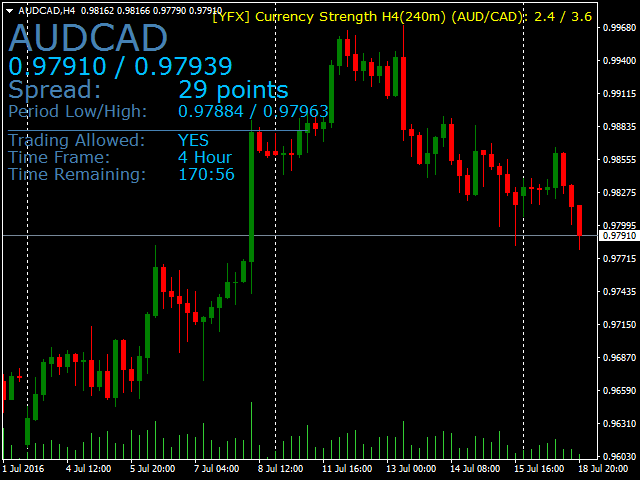
- Basisinformationen - Die allgemeinsten Informationen über ein Symbol. Dazu gehören der Name des Symbols, Geld-/Briefkurse und Spread-Daten. Dazu gehören auch der Tiefst- und der Höchstkurs, die während des aktuellen Zeitraums erreicht wurden.
- Zeitrahmeninformationen - Weitere Details über den aktuellen Zeitrahmen, der im Diagramm verwendet wird.
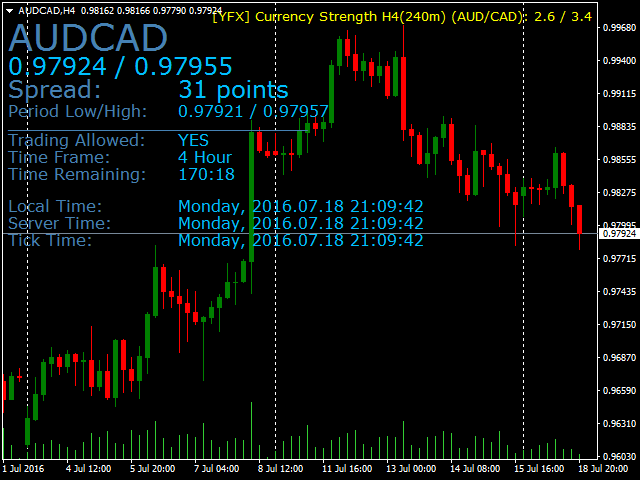
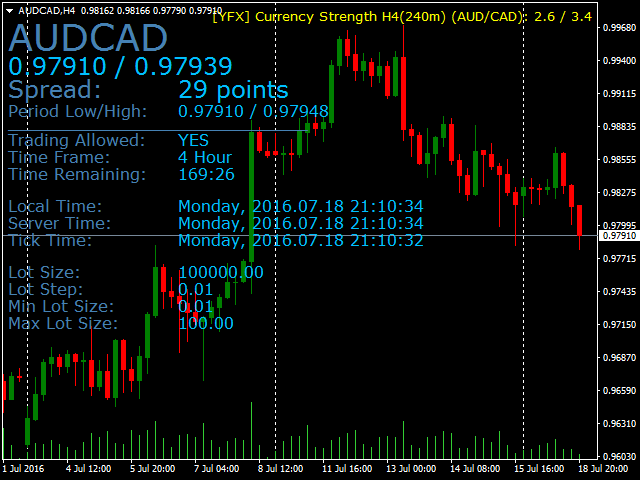
- Datums-/Zeitinformationen - Für verschiedene Positionen werden unterschiedliche Daten und Zeiten angezeigt.
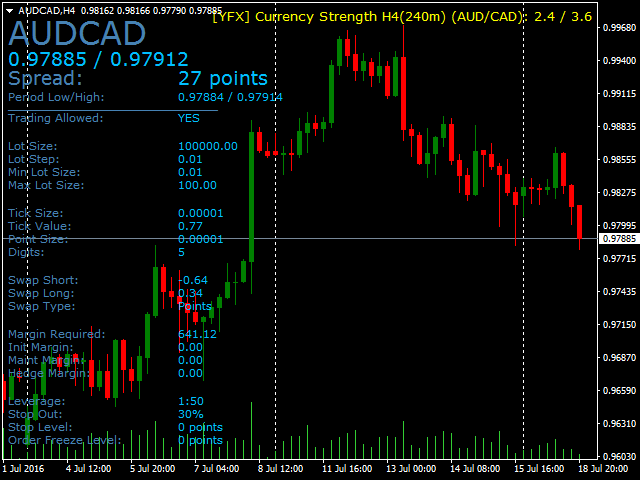
- Lot-Informationen - Alle vom Broker bereitgestellten Lot-Daten für das aktuelle Symbol.
- Tick-Informationen - Alle Details über Ticks für das aktuelle Chart-Symbol.
- Swap-Informationen - Viele Händler kennen die Swap- und Zinssätze, aber nur wenige können genau erklären, wie die Sätze für eine bestimmte Währung berechnet werden. Dieser Indikator nimmt Ihnen das Rätselraten ab und zeigt alle Swap-Informationen an. Er zeigt den Preis für das Leerverkaufen einer Menge des aktuellen Symbols an. Er zeigt auch den Preis an, zu dem man ein Lot long hält. Er zeigt auch die vom Broker verwendete Swap-Berechnungsmethode an.
- Margin-Informationen - Alle Margin-bezogenen Informationen werden für das Symbol angezeigt.
- Leverage-Informationen - Höhe der vom Broker angebotenen Leverage.
- Sonstige Informationen - Alle anderen bekannten Informationen über das aktuelle Symbol.
Alle Informationen können auf dem Chart angezeigt werden, so dass sie leicht zu lesen sind. Der Indikator verfügt außerdem über Parameter, mit denen Sie festlegen können, welche Informationen angezeigt werden sollen. Beachten Sie auch, dass sich die Kategorien nicht gegenseitig ausschließen. Informationen können auf mehrere Kategorien zutreffen, werden aber der Einfachheit halber nur in einem Abschnitt angezeigt.
Eingabeparameter des Indikators
Der Symboldatenindikator verfügt über zahlreiche Parameter, mit denen die Anzeige individuell angepasst werden kann. Die Parameter sind wie folgt kategorisiert:
- YFX_SDAT_INDICATOR - Abschnitt der Parameter, die das Verhalten des Indikators steuern.
- YFX_SDAT_DISPLAY - Abschnitt mit Parametern, die festlegen, welche Informationen tatsächlich auf dem Chart angezeigt werden.
- YFX_SDAT_GUI - Abschnitt mit Parametern, die die Darstellung des Indikators im Chart steuern.
- YFX_SDAT_FONT - Abschnitt der Parameter, die es ermöglichen, die Schriftarten zu ändern, einschließlich Schriftart, -name und -größe.
- YFX_SDAT_COLOR - Abschnitt mit Parametern, die die Farben für die Anzeige von Informationen im Diagramm steuern.
Allen Parametern sind Standardwerte zugewiesen, die in den meisten Fällen ausreichen sollten. Es ist ratsam, die Werte nicht zu ändern, bis man sich mit dem Indikator besser vertraut gemacht hat. Dann können bestimmte Parameter getestet werden, um festzustellen, welche Funktionen des Indikators von welchen Parametern beeinflusst werden.