YFX Symbol Watermark
- Indicadores
-
Richard Yancy
 Independent FX trader
 - Versión: 6.1
- Actualizado: 23 mayo 2022
- Activaciones: 5
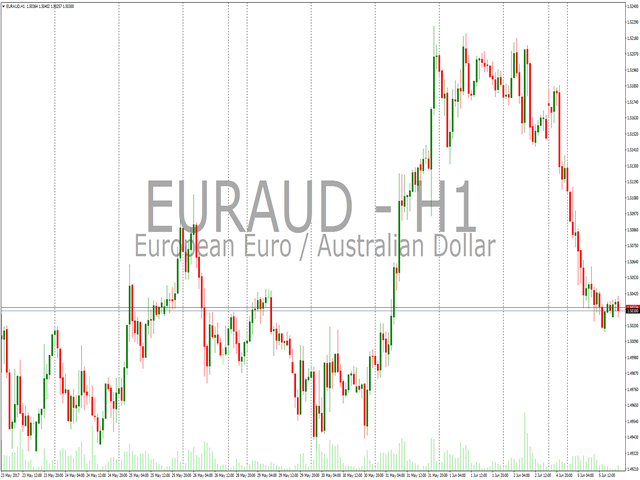
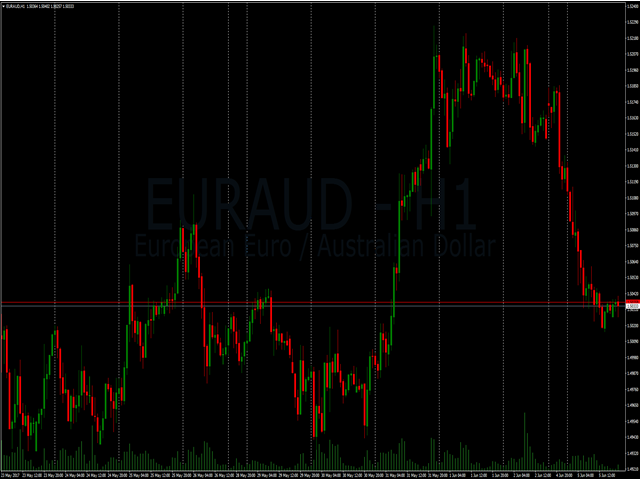
El indicador YFX Symbol Watermark se utiliza para mostrar una marca de agua en su gráfico, lo que facilita ver de un vistazo la información del símbolo de cualquier gráfico. La información mostrada incluye:
- Nombre del símbolo y marco temporal en el gráfico
- Descripción de las divisas
- Línea de etiqueta, que puede contener cualquier información definida por el usuario
Toda la información puede mostrarse en el gráfico para que pueda leerse fácilmente. El indicador también tiene parámetros que se pueden configurar para personalizar la información que se muestra. Los parámetros están organizados en categorías:
- Indicador
- Fuente
- Color
- Visualización
Tenga en cuenta que las categorías no se excluyen mutuamente. La información puede ser aplicable a varias categorías, pero sólo se mostrará en una sección para simplificar. Todos los parámetros están asignados a valores por defecto que funcionan bien en la mayoría de los casos. Se aconseja no cambiar los valores por defecto hasta que uno se familiarice con el indicador.
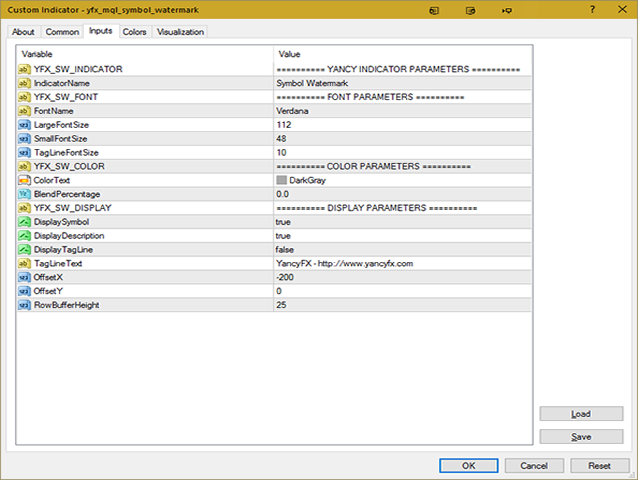
Sección: YFX_SW_INDICATOR
- IndicatorName: "Symbol Watermark" - Nombre del indicador que se incluye en el nombre que aparece en la ventana de datos.
Sección: YFX_SW_FONT
- FontName: "Verdana" - Fuente utilizada para mostrar el texto del indicador. Puede ser cualquier fuente disponible en su sistema.
- LargeFontSize: 56 - Tamaño de la fuente más grande utilizada para mostrar el símbolo del gráfico.
- SmallFontSize: 24 - Tamaño de la fuente más pequeña utilizada para mostrar la descripción del símbolo en el gráfico.
- TagLineFontSize: 8 - Tamaño por defecto de la fuente utilizada para mostrar la línea de etiqueta en el gráfico.
Sección: YFX_SW_COLOR
- ColorText: "SteelBlue" - Color utilizado para dibujar el texto en el gráfico.
- BlendPercentage: 70.0 - Cantidad de mezcla (transparencia) a utilizar para el color del texto.
Sección: YFX_SW_DISPLAY
- MostrarSímbolo: true - Muestra información del símbolo si es true
- DisplayDescription: true - Muestra la descripción del símbolo si es cierto.
- DisplayTagLine: false - Muestra la línea de la etiqueta si es verdad.
- TagLineText: "http://www.yancyfx.com " - Texto para mostrar como línea de etiqueta. Sólo se muestra si el indicador está activado.
- OffestX: 0 - Ajuste de la ubicación a lo largo del eje temporal. Se trata de un desplazamiento desde el centro del gráfico.
- OffsetY: 0 - Ajuste de la posición a lo largo del eje de precios. Se trata de un desplazamiento desde el centro del gráfico.
- RowBufferHeight: 5 - Cantidad de espacio a dejar entre líneas de texto en el indicador. Valor en número de píxeles.