Correlation Index Pro
- Indicadores
-
Makarii Gubaydullin
 Asistente de Comercio Multifuncional
MT5: https://www.mql5.com/es/market/product/71145 - Versión: 1.10
- Actualizado: 3 octubre 2023
- Activaciones: 5
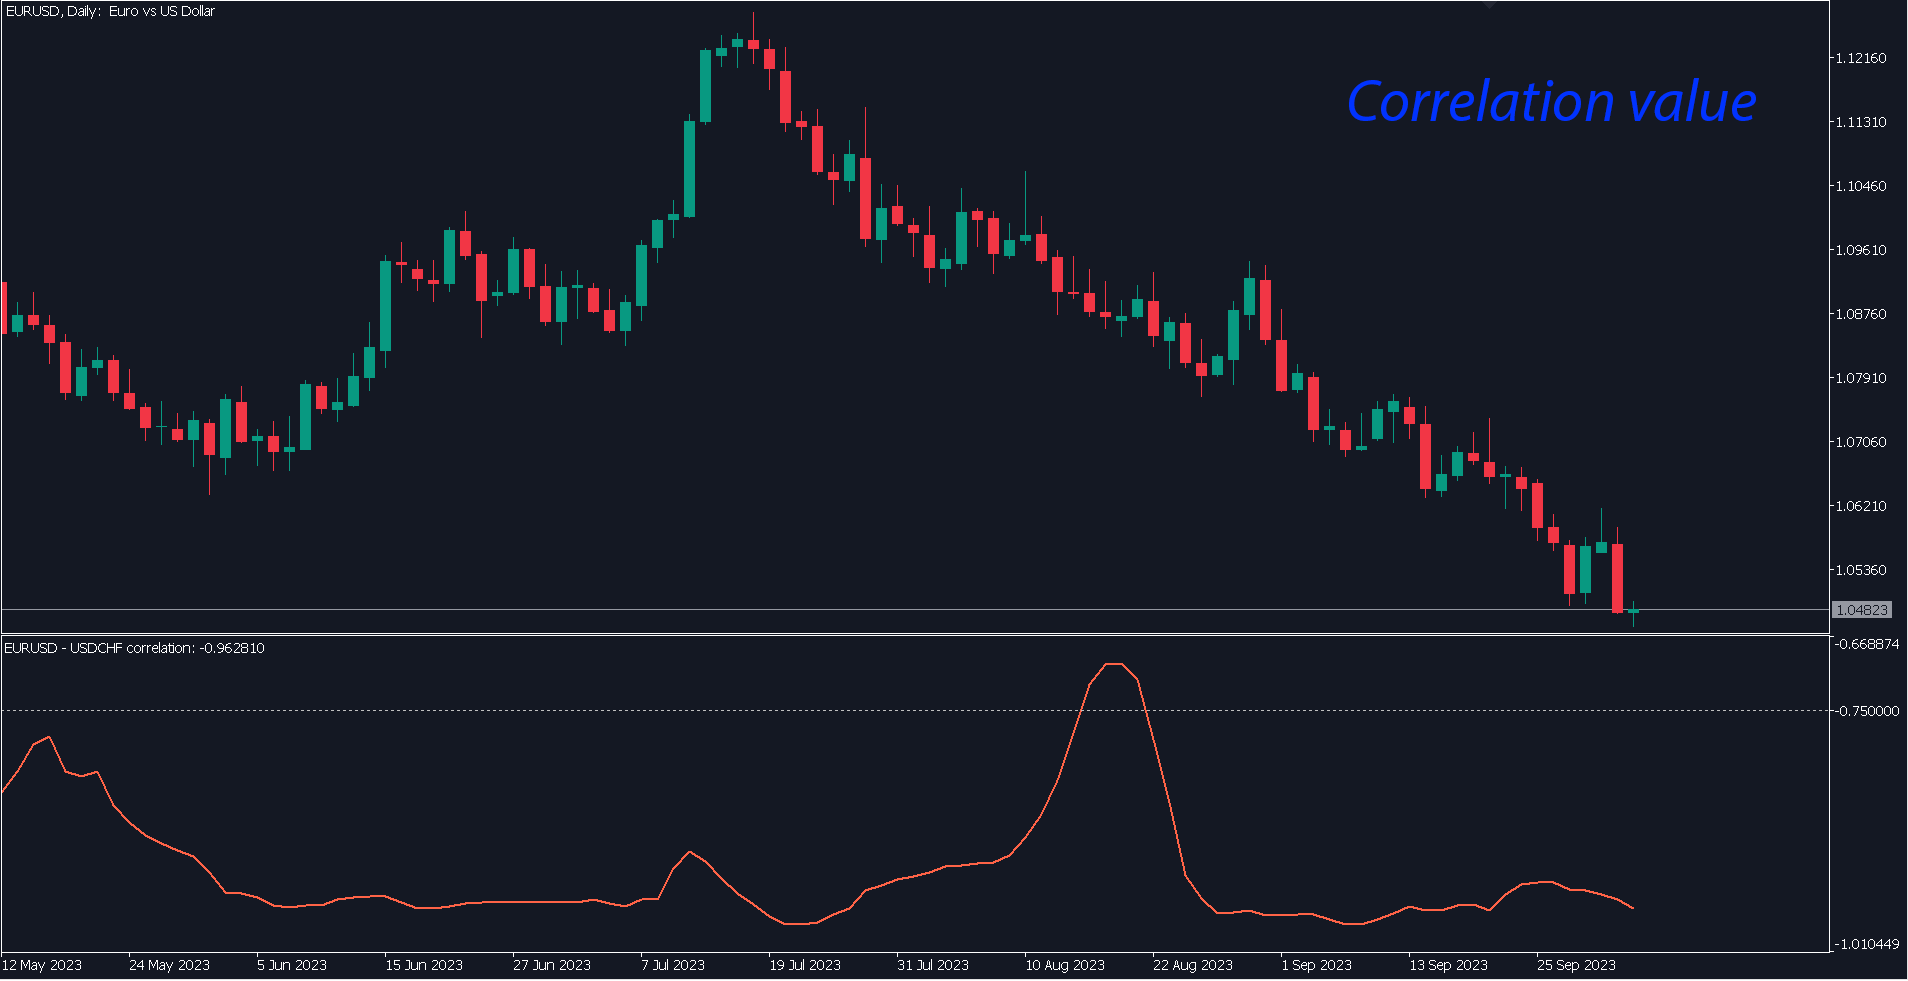
Valor de correlación entre dos símbolos.
- Un valor de +1 significa una correlación positiva completa;
- Un valor de -1 significa una correlación inversa completa;
- Un valor de 0 significa que no hay correlación explícita (los precios no dependen unos de otros, o la correlación es aleatoria);
Utilidad multifuncional: incluye 66+ funciones | Contácteme si tiene alguna pregunta
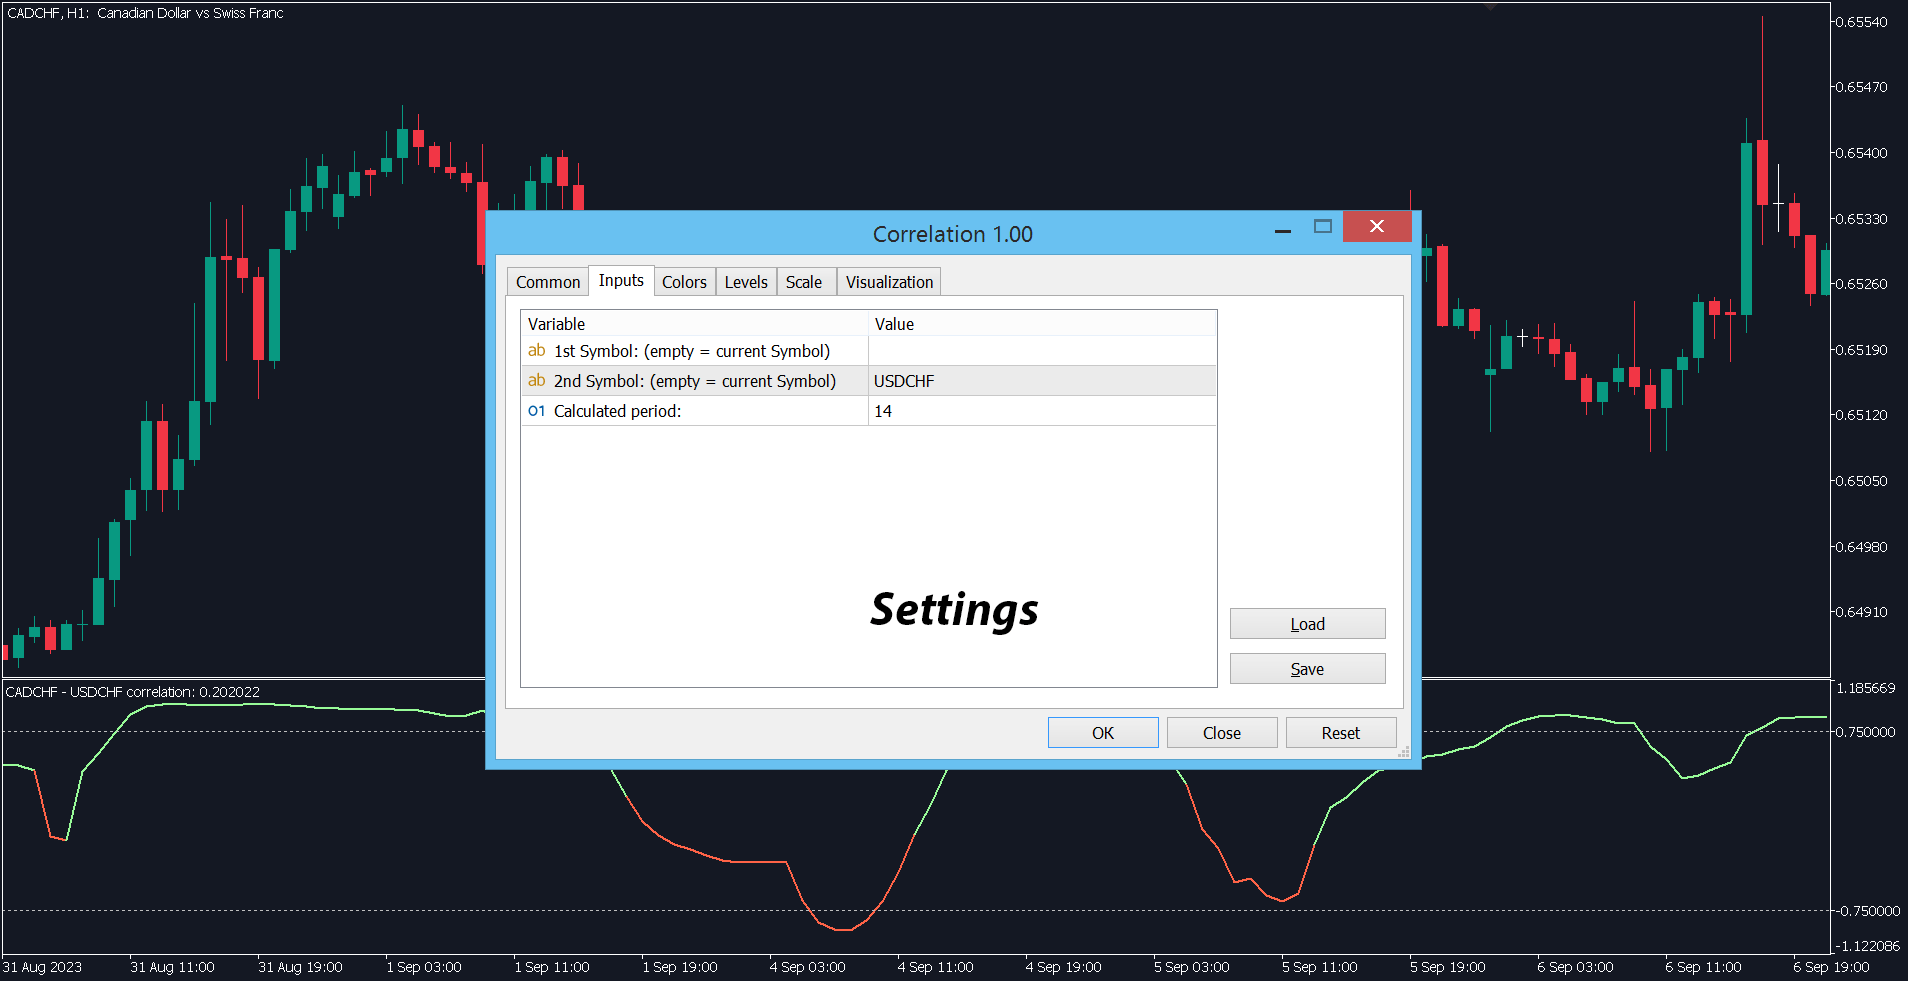
En la configuración del indicador, puede ajustar:
- Símbolos (pares de divisas) que se usarán en los cálculos.
Deje un valor vacío si desea que uno de los símbolos siempre coincida con el símbolo del gráfico. - El período (el número de barras del marco temporal utilizado) que se usará para el cálculo.
-
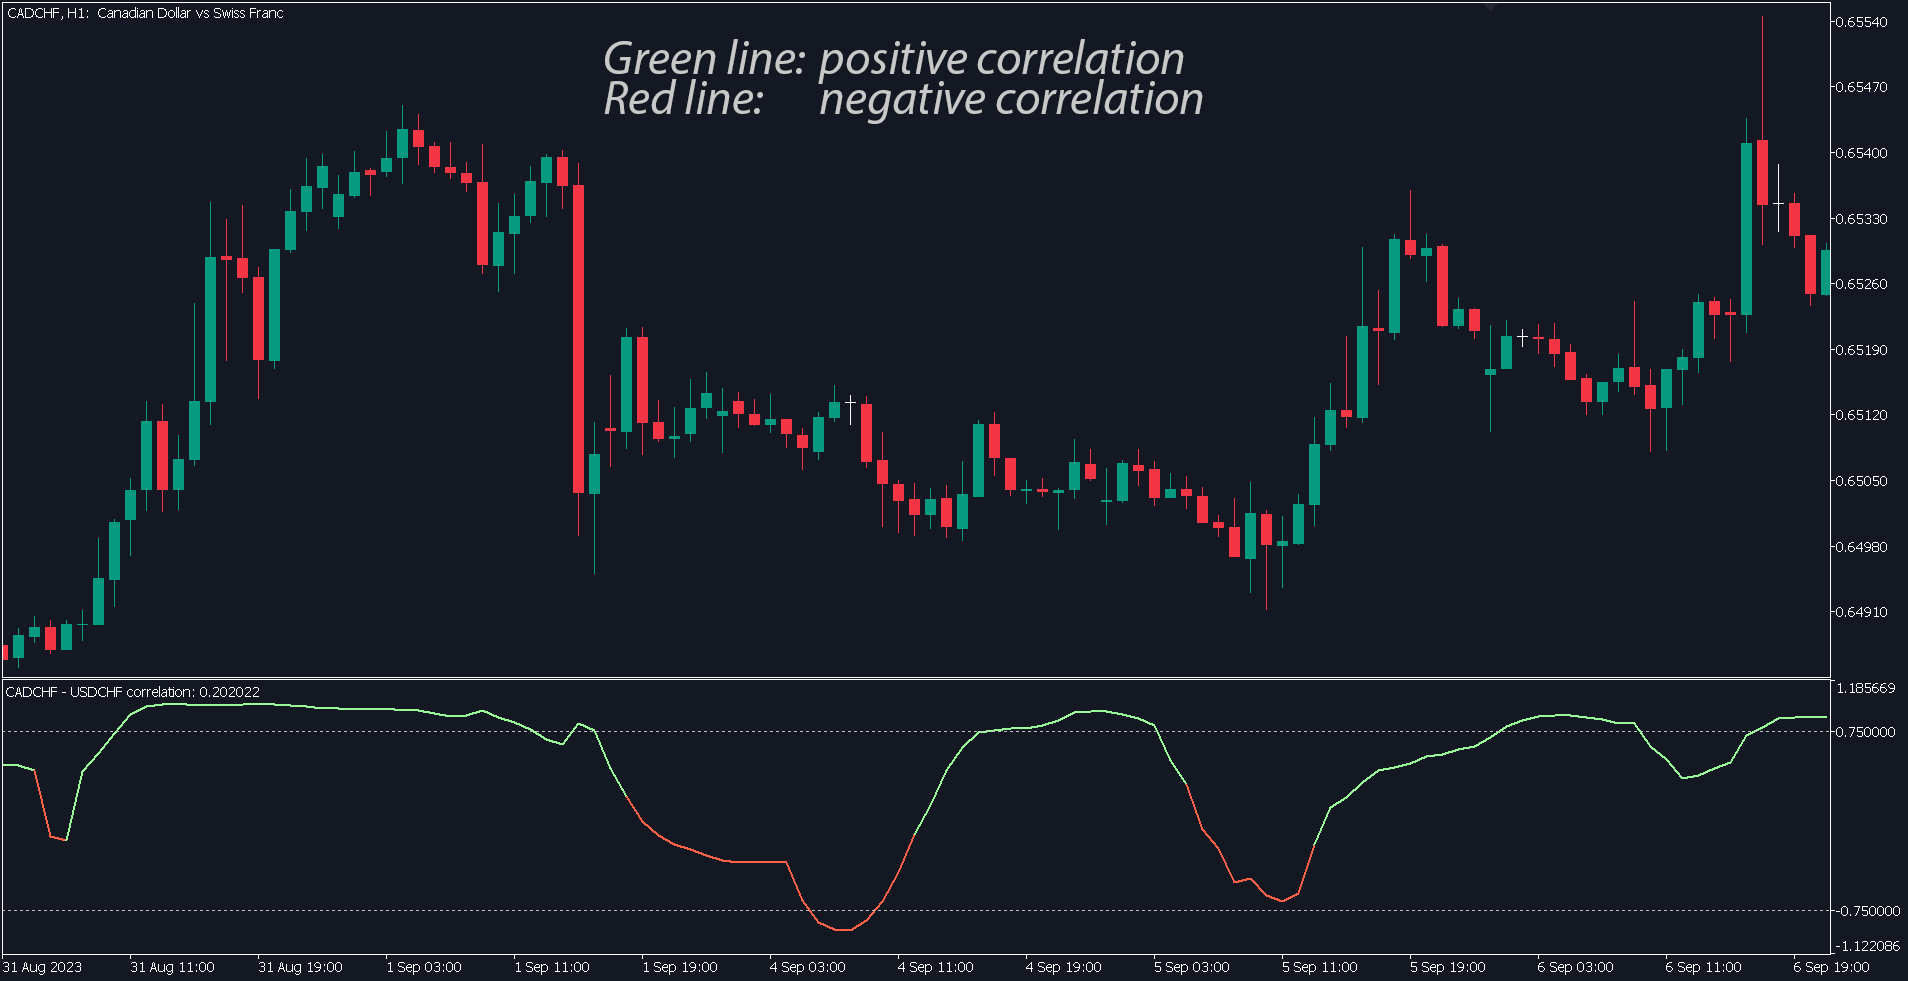
Todos los estilos, tamaños y colores son personalizables.
La línea roja visualiza valores negativos, y la línea verde representa valores positivos.
El archivo del programa debe colocarse en el directorio "Indicators".