Correlation Index Pro
- Göstergeler
- Sürüm: 1.10
- Güncellendi: 3 Ekim 2023
- Etkinleştirmeler: 5

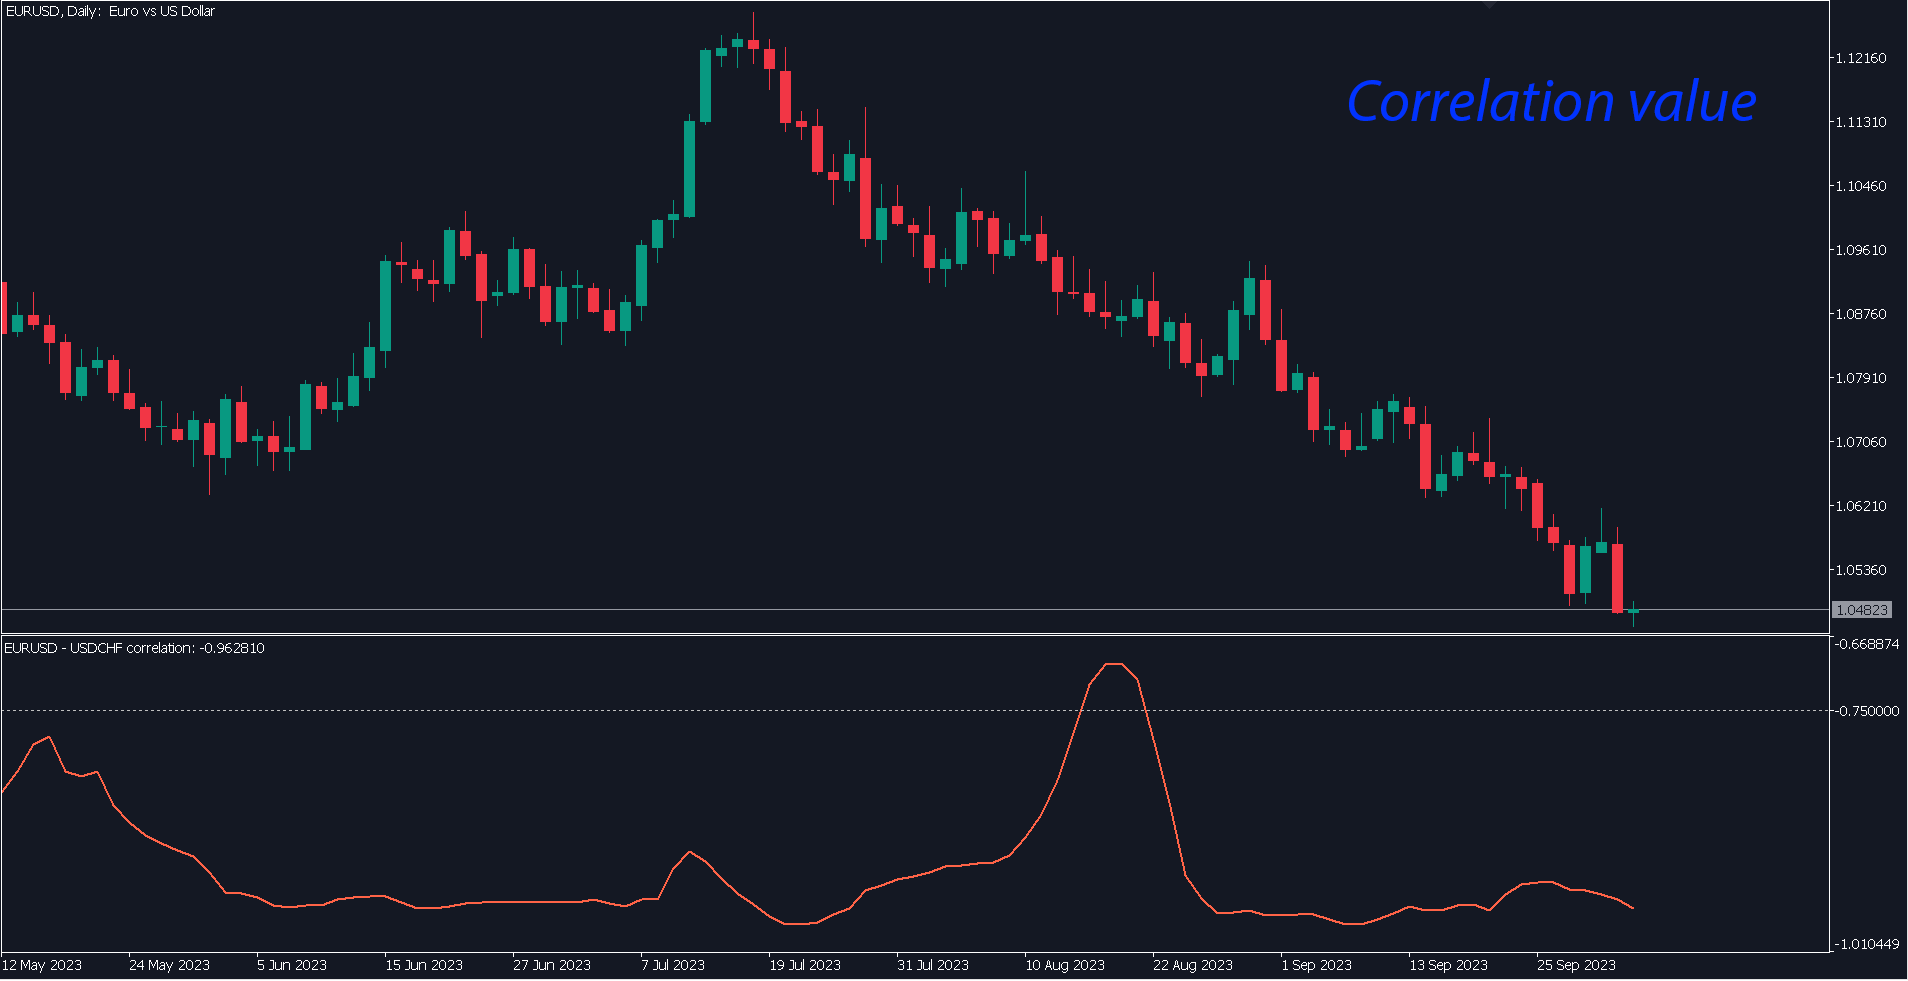
İki sembol arasındaki korelasyon değeri.
- +1 değeri tam pozitif korelasyonu ifade eder;
- -1 değeri tam ters korelasyonu ifade eder;
- 0 değeri açık bir korelasyon olmadığını ifade eder (fiyatlar birbirine bağlı değildir veya korelasyon rastgeledir);
Çok fonksiyonlu araç: 66+ fonksiyon içerir | Sorularınız varsa bana ulaşın
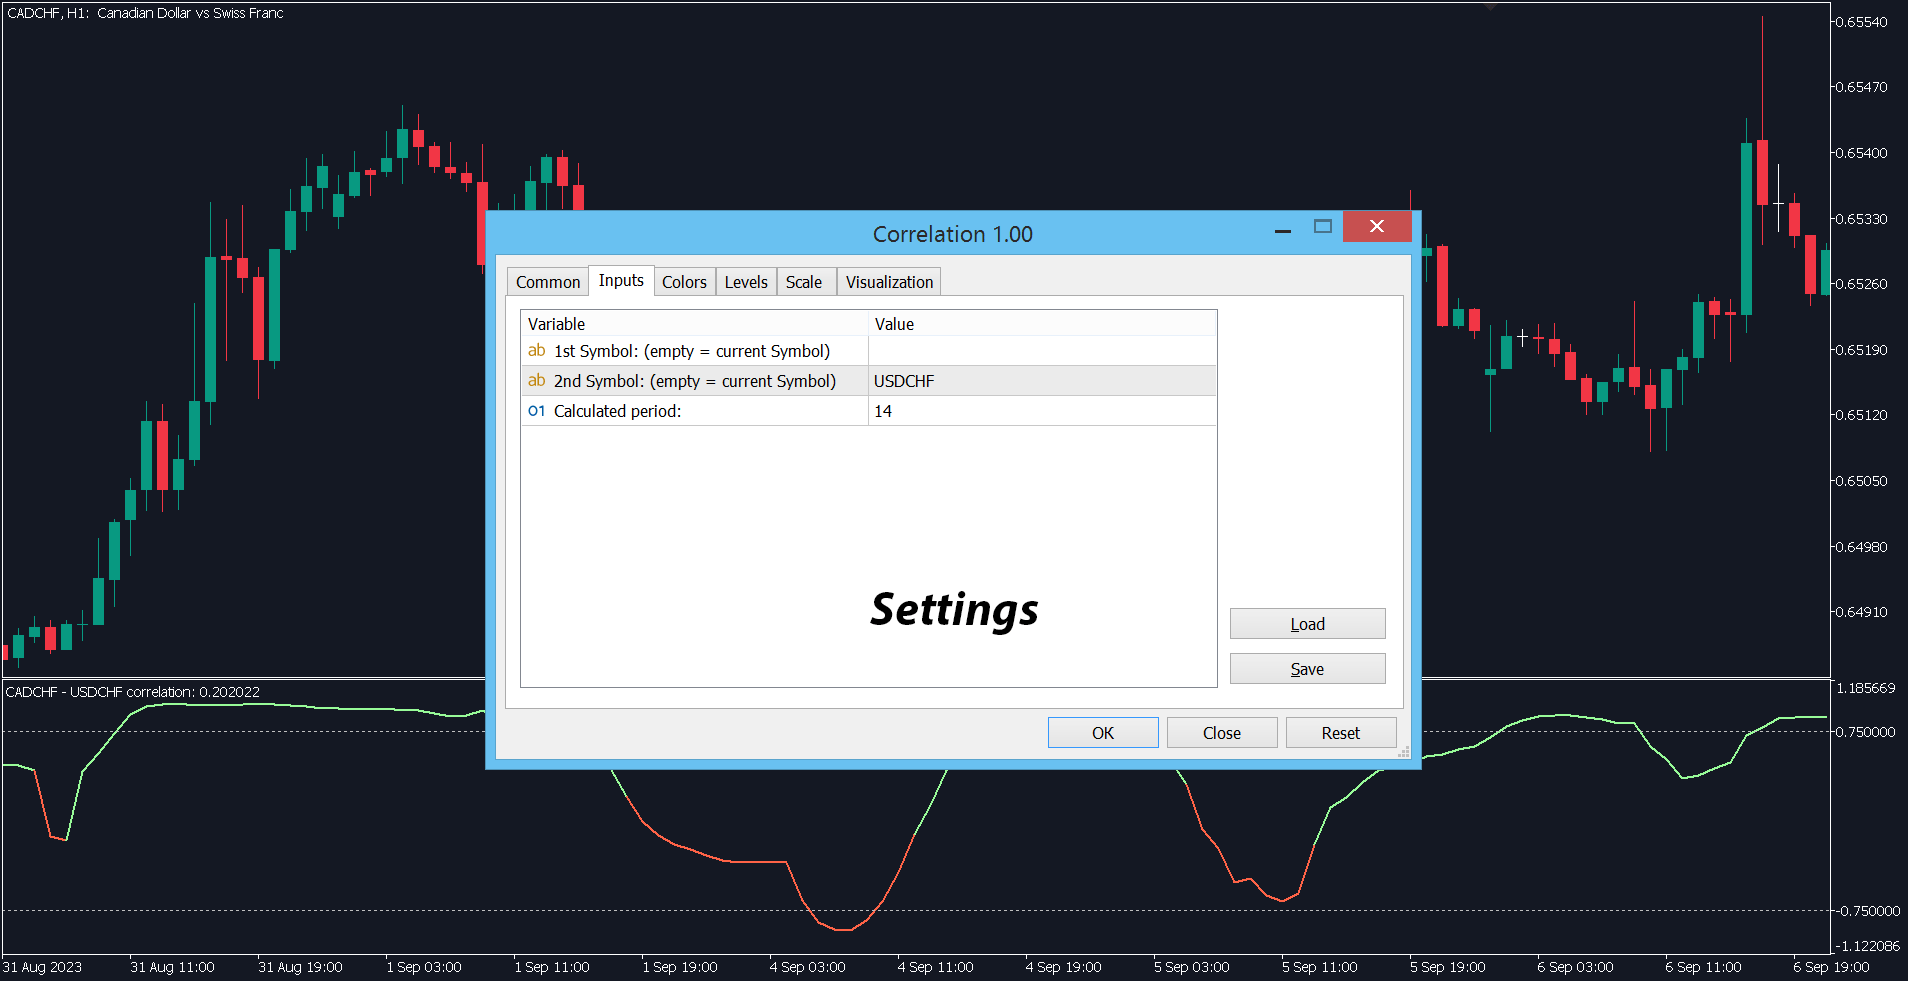
Gösterge ayarlarında şunları yapılandırabilirsiniz:
- Semboller (döviz çiftleri) hesaplamalarda kullanılacak.
Bir değeri boş bırakırsanız, sembollerden biri her zaman grafik sembolüyle eşleşir. - Dönem (hesaplama için kullanılan zaman diliminin bar sayısı).
-
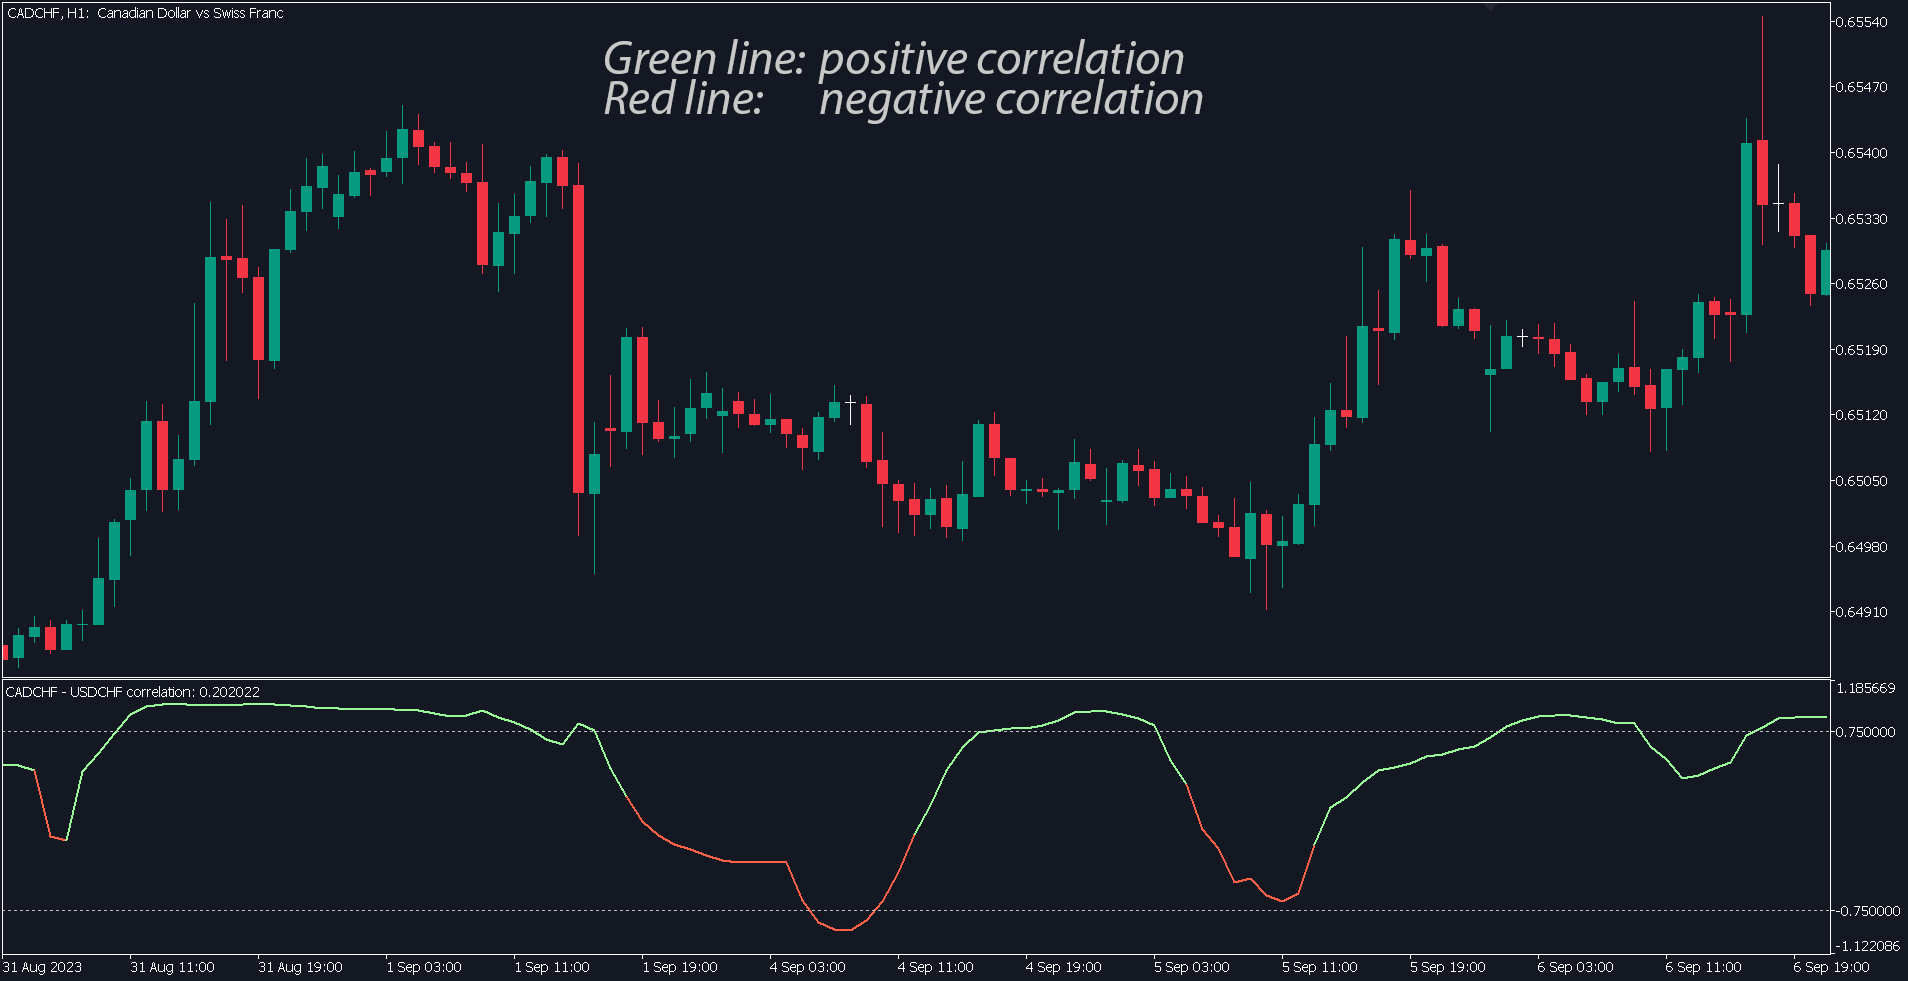
Tüm stiller, boyutlar ve renkler özelleştirilebilir.
Kırmızı çizgi negatif değerleri görselleştirir, yeşil çizgi ise pozitif değerleri temsil eder.
Program dosyası "Indicators" dizinine yerleştirilmelidir.
```