Francisco Gomes Da Silva
- programador at Suzano - SP, Brazil
- Brazil
- 149780
|
8+ years
experience
|
34
products
|
53
demo versions
|
|
36
jobs
|
0
signals
|
0
subscribers
|
Welcome to my profile, I am a developer of systems and currently I am working only with the language of the metatrade, but I have as goal to create script for tradingview too

Francisco Gomes Da Silva
Published product

· 1
ummagummabr
2023.07.30
Vc não sabe nem o que é preço médio, chama de "estratégia que não funciona". Vai publicar ea de estratégia? Comenta aqui pro povo ler que fazer um ea simples de preço médio é estratégia pro povo ler e comentar
Francisco Gomes Da Silva
Published product
· 1
Francisco Gomes Da Silva
2023.05.28
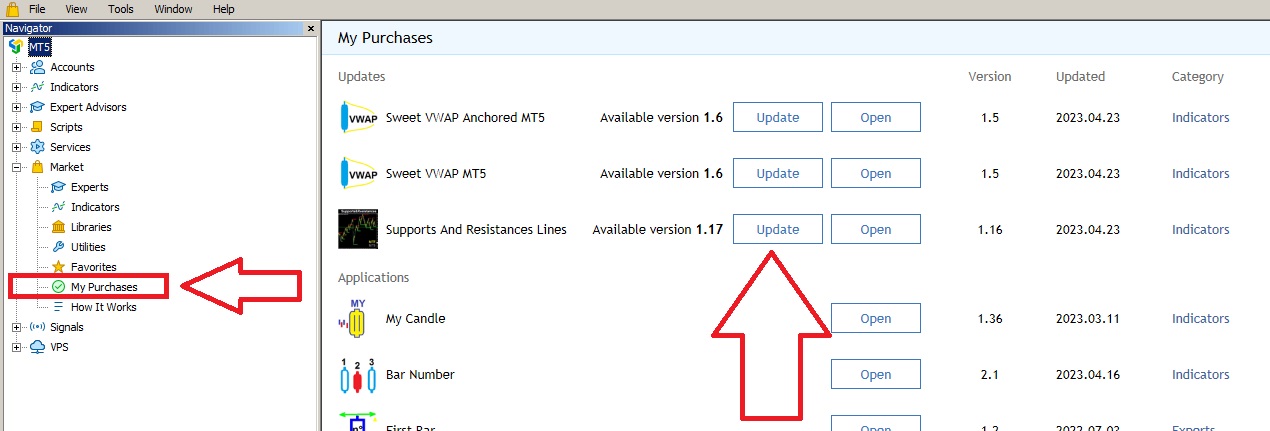
download the free Supports and Resitances Lines, this trailing uses the last top or bottom based on that https://www.mql5.com/pt/market/product/98590
ummagummabr
2023.07.30
Vc não sabe nem o que é preço médio, chama de "estratégia que não funciona". Vai publicar ea de estratégia? Comenta aqui pro povo ler que fazer um ea simples de preço médio é estratégia pro povo ler e comentar