Volume Anchor Levels
- Indicators
-
Suvashish Halder
 💧 PRO TIP - Don't Open Orders Where You See, Open Them Where Others Can't!
📈 Decoding Market Phases Like Never Before – The SuvashishFx Revolution! - Version: 1.0
- Activations: 10
Volume Anchor Levels: support & resistance anchored to traded volume
Most support and resistance tools draw a line at the exact high or low of a swing. But price rarely turns at the exact tip of a wick. It turns where the market actually traded. Volume Anchor Levels builds a rolling volume profile and pulls each swing toward the strongest nearby volume node, so you get levels that sit where trading really happened. Each level gets a 0-100 score, so you can see right away which levels are worth watching.
🛑 Join To Learn Market Depth - https://www.mql5.com/en/channels/suvashishfx
How it works
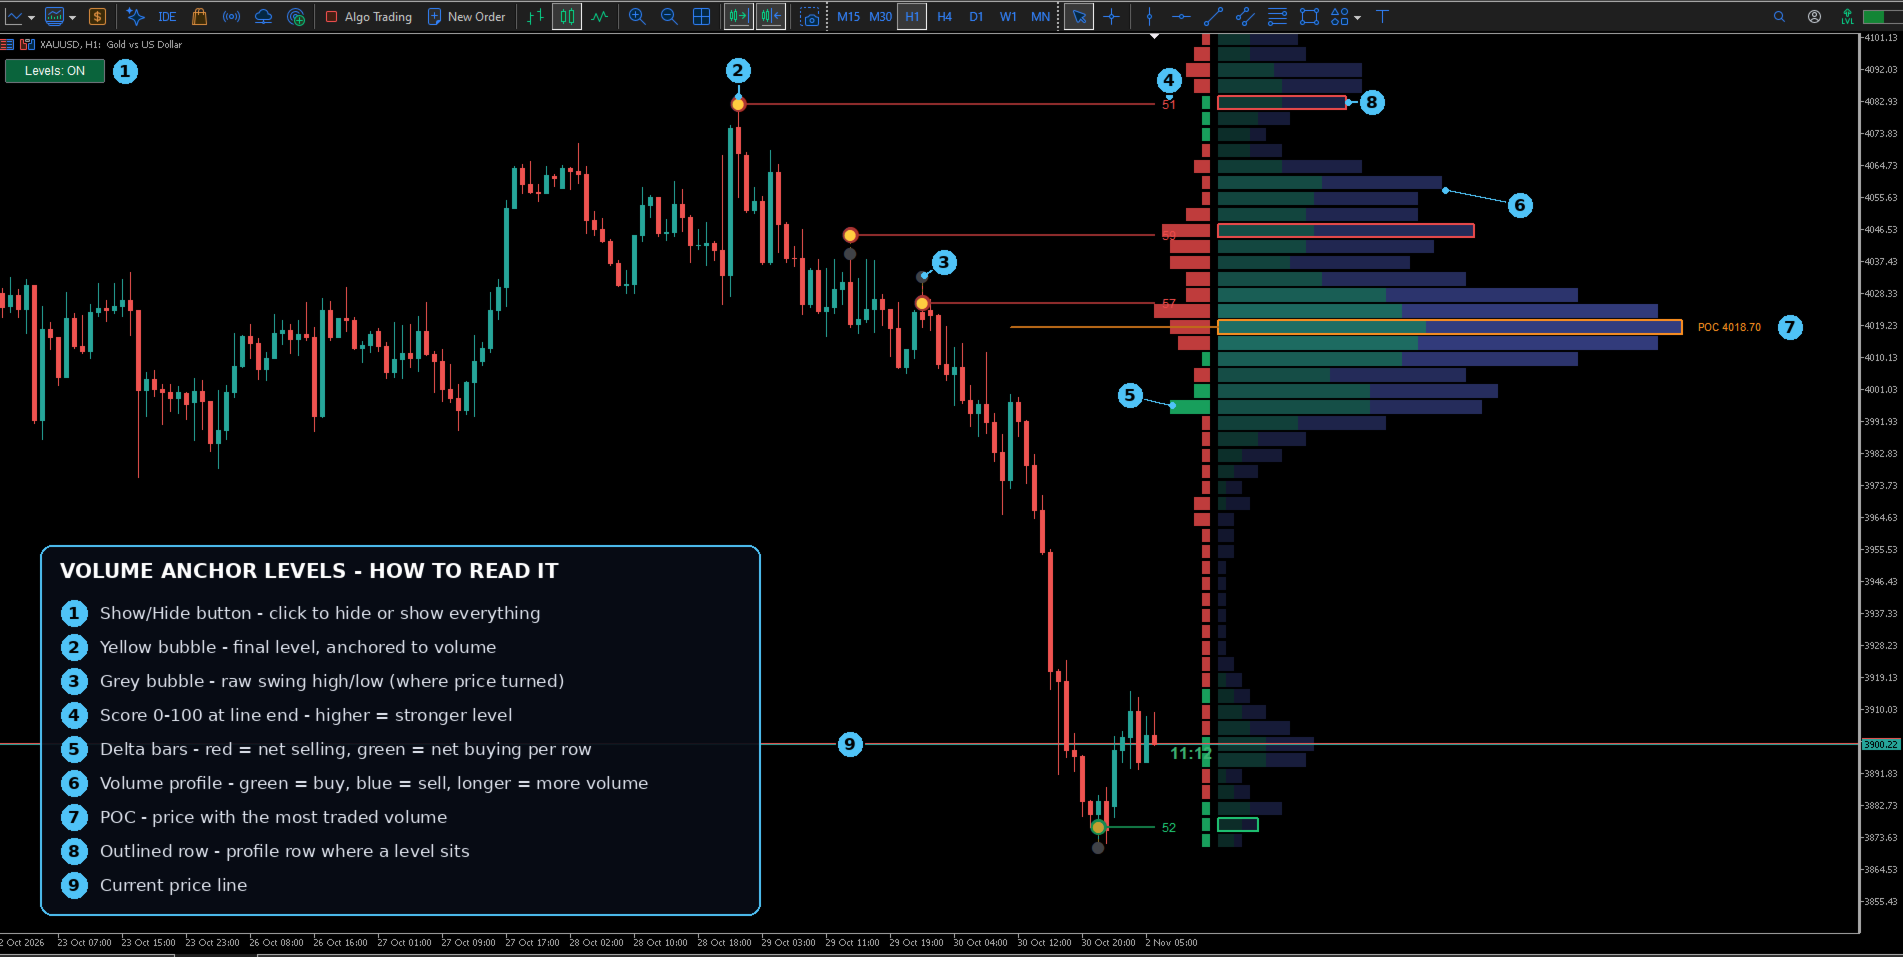
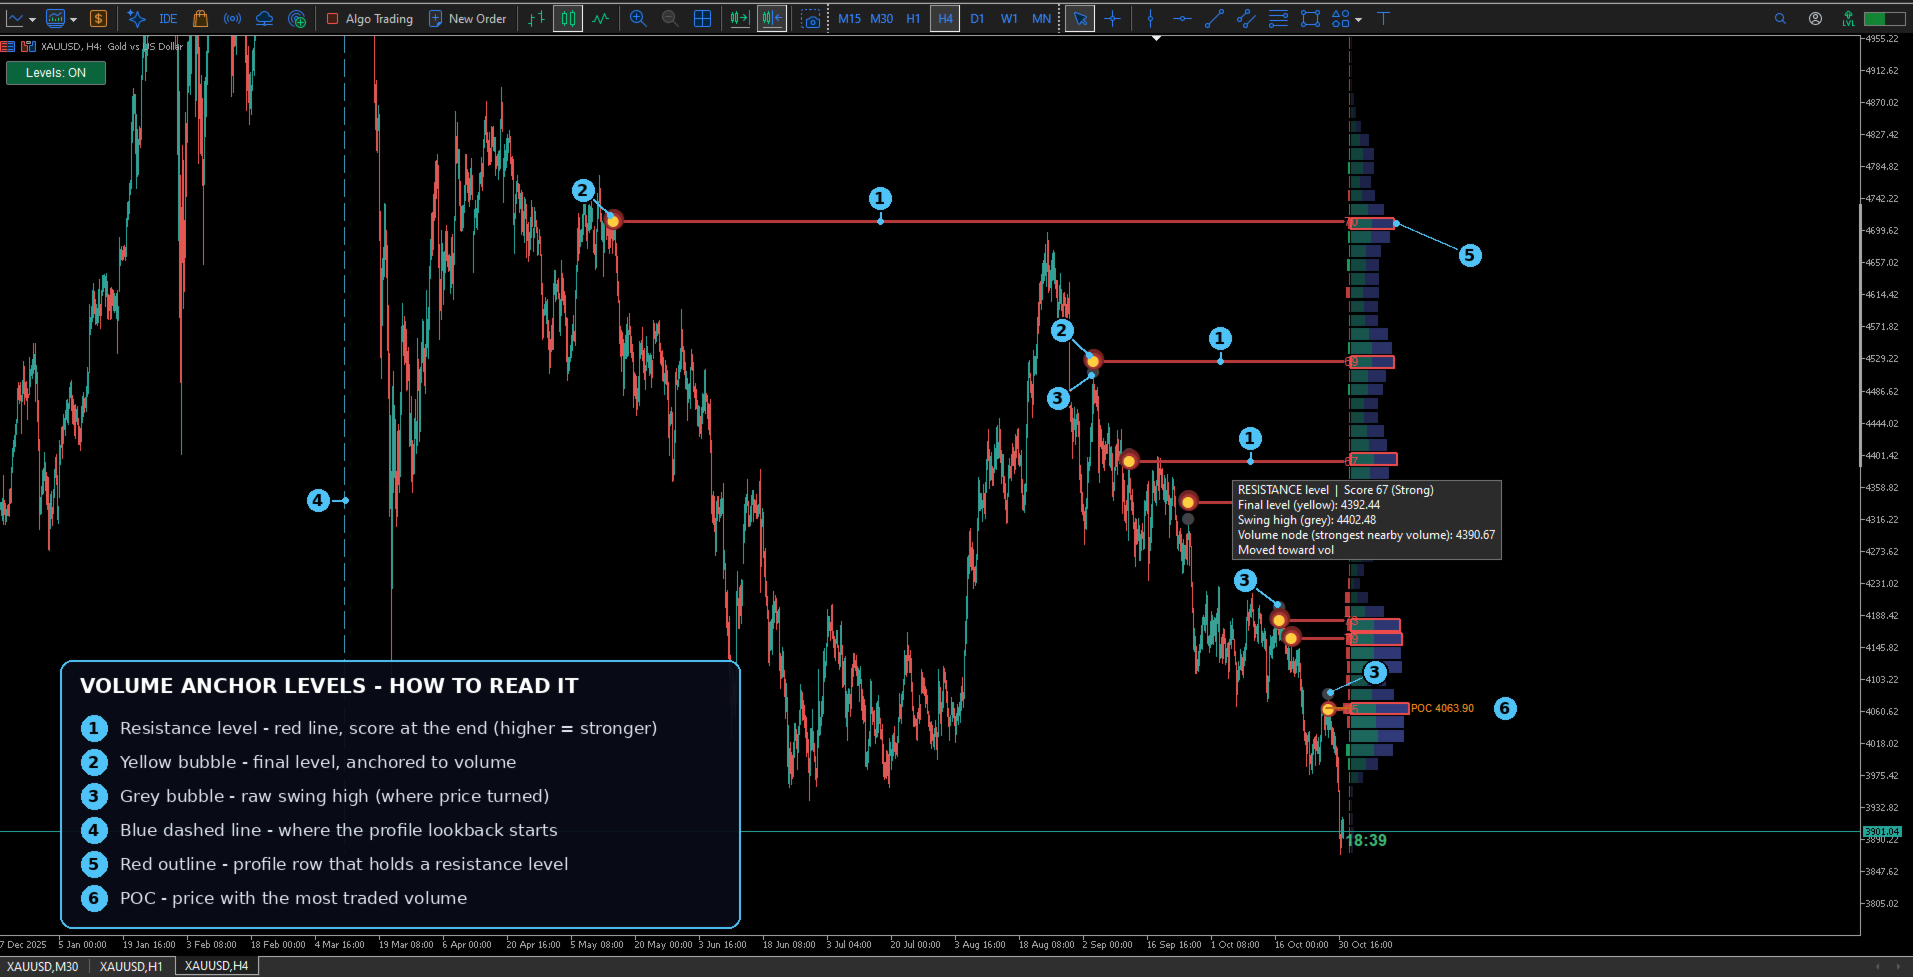
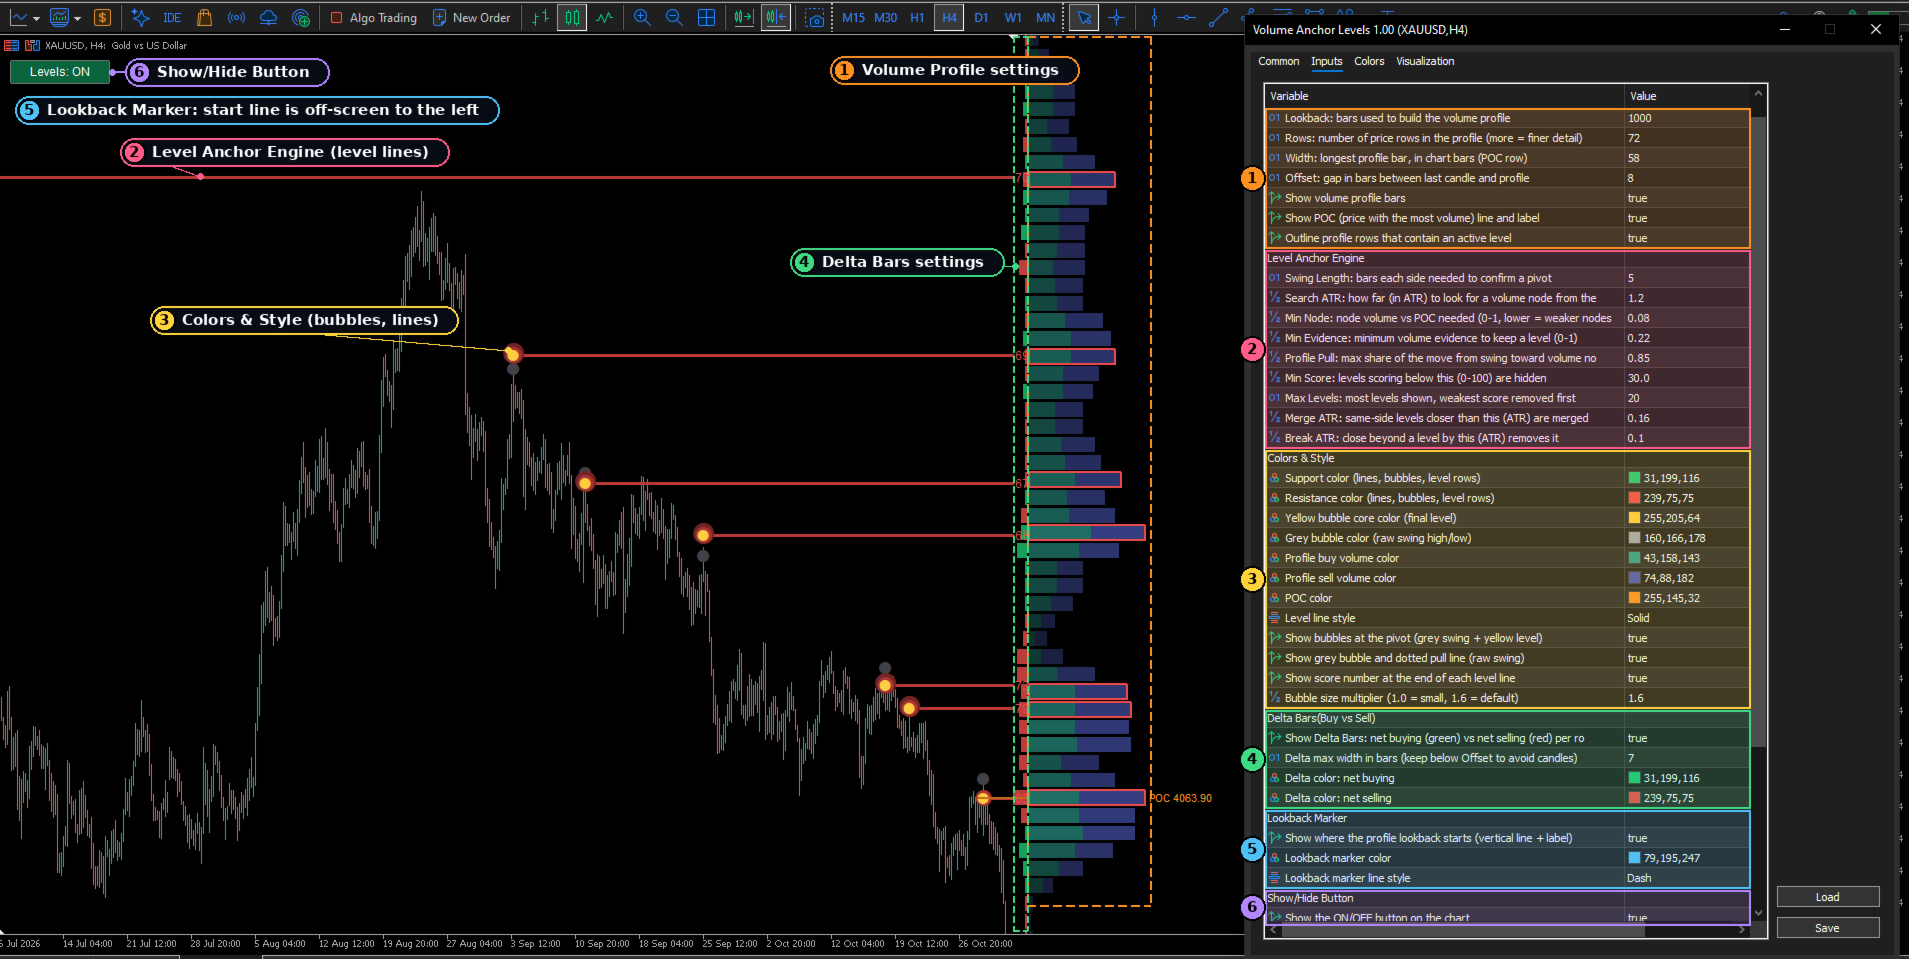
- Swing detection. The indicator finds confirmed swing highs and lows (the grey bubble marks the raw swing).
- Volume anchoring. It builds a volume profile for the lookback window and looks for the strongest volume node near that swing. The level is then shifted toward that node. The yellow bubble marks the final level.
- Scoring. Every level gets a 0-100 score that combines:
- 50% volume-node evidence (how strong the nearby volume node is)
- 20% absorption (heavy volume with small candle bodies)
- 15% pivot-bar volume compared with its average
- 15% wick rejection
- Lifecycle. Levels that price closes through are removed. Nearby levels are merged. If there are too many, the weakest-scored ones are dropped first.
What you see on the chart
- Level lines with the score at the end. Stronger levels are thicker and more opaque.
- Grey and yellow bubbles at the pivot, so you can see how far volume moved the level from the raw swing.
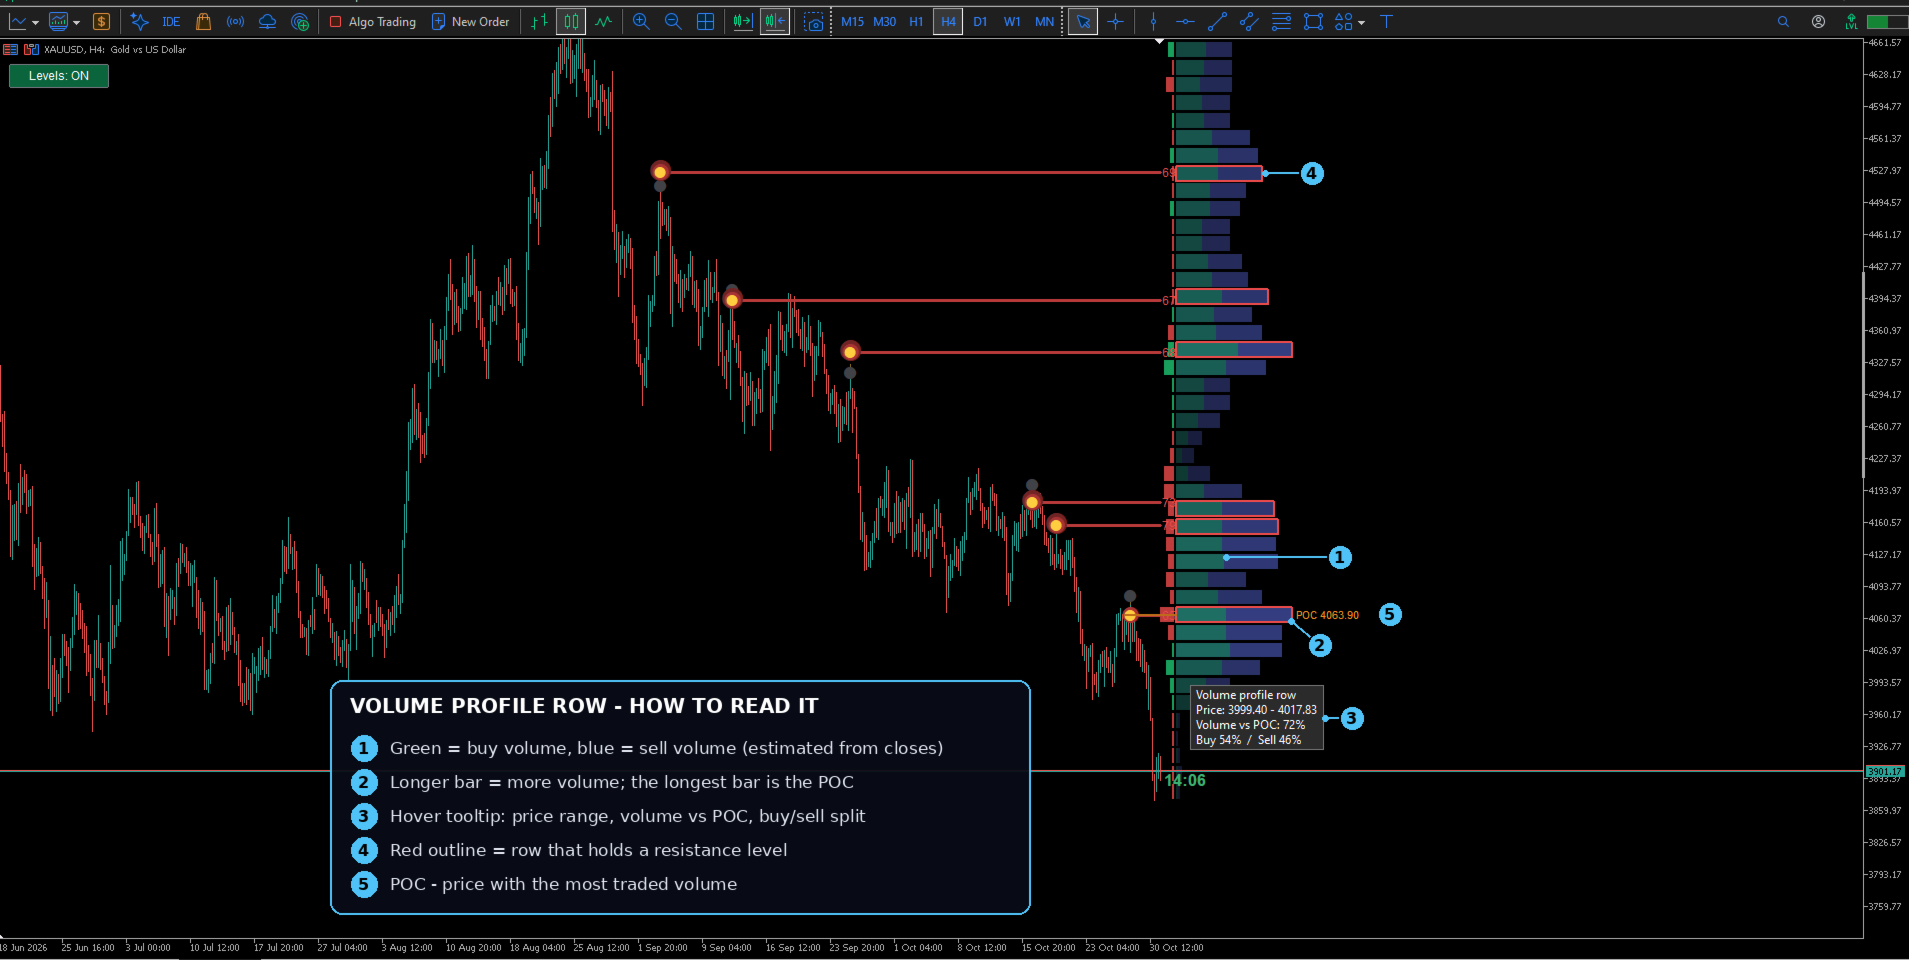
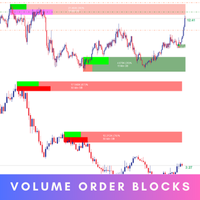
- Rolling volume profile on the right with the buy/sell split and the POC (the price with the most volume).
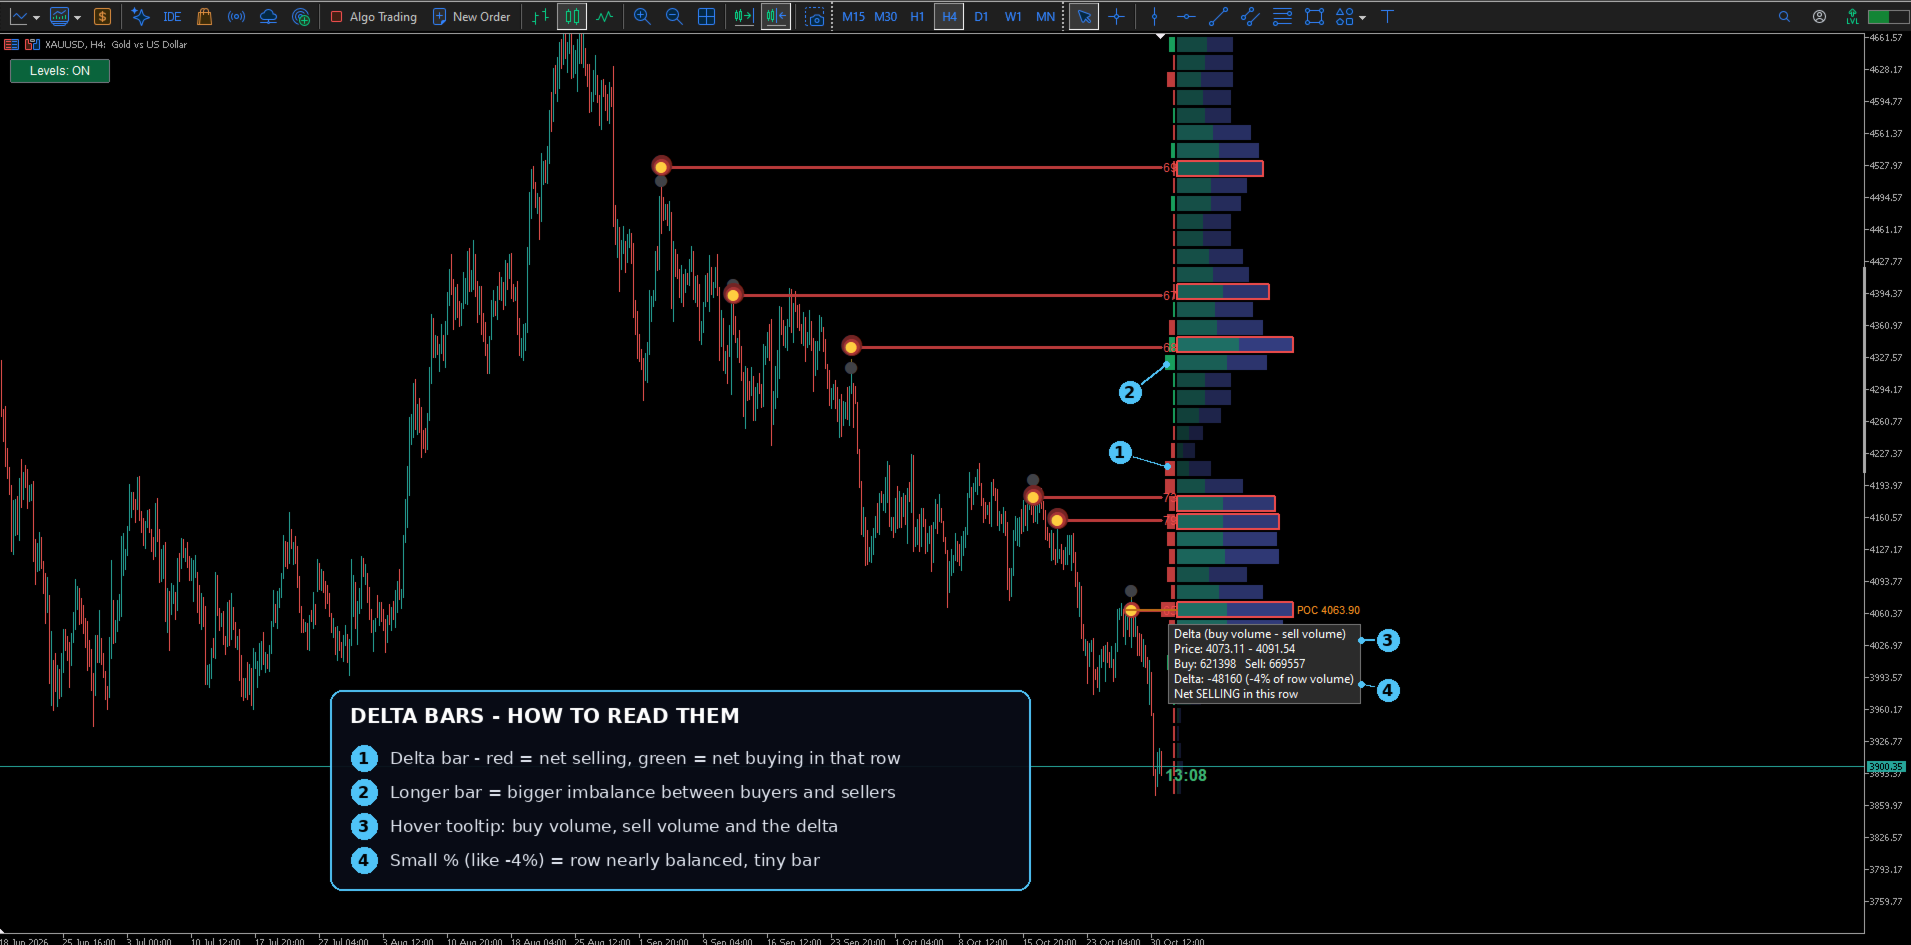
- Delta bars that show net buying (green) or net selling (red) for each price row.
- Hover tooltips on every part, showing the score, price, volume evidence, points moved and the formation time.
- On-chart Show/Hide button, which you can place in any of the four corners.
- Optional alerts for new levels and for broken levels.
Why traders use it
- A ranking, not just lines. A chart with 15 lines is noise. The scores let you focus on the 3 or 4 levels that have the most evidence.
- Levels at traded prices. Anchoring to volume helps place levels where orders actually traded, not at the thin tip of a wick.
- Context at a glance. The profile, POC and delta bars sit next to the levels, so you can see if a level lines up with heavy volume.
- A clean chart. One button hides everything, and the bubble size, colors and line style are adjustable.
How to use it
Use it with your own plan. A typical approach is to watch levels with higher scores (for example 60 and above) as areas of interest, and to check price action, a candle close or your usual confirmation before acting. Lower the Min Score setting to see more levels, or raise it to see fewer.
Settings
Every input has a description in the settings window: profile lookback and rows, swing length, search distance, minimum evidence and score, maximum levels, merge and break distances, colors, bubble size, delta bars, button position and alerts.
Important notes
- The buy/sell split and delta bars are estimated from tick volume and where each candle closes. They are not true bid/ask order-flow data.
- Scores rank levels against each other. They are not win probabilities, and no level is guaranteed to hold.
- Works on any symbol and timeframe, and was designed with XAUUSD in mind. On first load it replays recent history, which can take a moment on very large charts.
- This is an analysis tool and not a trading signal. Trading carries risk. Test on a demo account first.