KT Ichimoku Cross EA MT5

KT Ichimoku Cross EA trades one complete Ichimoku system for you: the Tenkan-sen and Kijun-sen cross, confirmed by the cloud, with a stop loss and a take profit on every trade from the moment it opens. No strategy menu and no guesswork. It installs with the exact settings that were tested on five years of USDJPY history.

Tested on five years of USDJPY

The default settings were tested on five years of USDJPY on the 1 hour chart in one continuous run, at 1% risk per trade, with the broker's spread, commission and swap taken out of every trade. The full results, with cloud confirmation on and off, are in the screenshots.

Every trade targets three times its risk, so the EA does not need to win most of its trades to move the balance forward.

How it trades

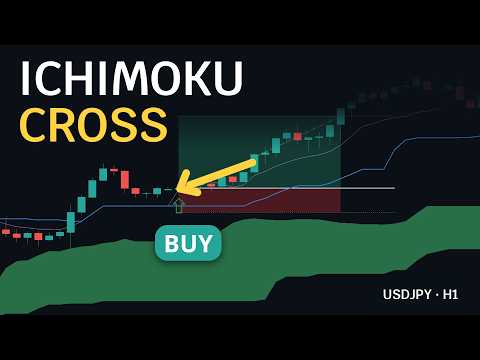
When the Tenkan-sen crosses the Kijun-sen and the signal bar closes clear of the cloud, the EA opens a trade at the close of that bar, in the direction of the cross. The trade then runs until it reaches its stop loss or its take profit. An opposite cross in the meantime never cuts a winning trade short.

Why traders choose it

  • Ready from the first minute: attach it to a USDJPY 1 hour chart and it trades the tested method. Nothing to set up and no settings to hunt for.
  • A fixed plan for every trade: the stop loss sits just beyond the Kijun-sen and the take profit at three times the risk, both placed the moment the trade opens.
  • Your risk, always the same: the lot size is worked out from the stop loss distance, so every trade risks the same percent of your balance. A fixed lot is there if you prefer it.
  • Fewer, cleaner trades: cloud confirmation opens a trade only when the signal bar closes clear of the cloud. One switch turns it off if you want every cross.
  • Careful by design: one position at a time, setups with an unusually wide stop loss are skipped, and an optional maximum spread check keeps it out of expensive moments. No grid, no martingale and no averaging down.
  • The same signals on any chart: Ichimoku is calculated inside the EA, so its signals stay the same whatever else is loaded on the chart.
  • Always informed: popup, push and email alerts for every trade it opens.

Recommendations

USDJPY on the 1 hour chart with the default settings, any broker, and an account size that supports 1% risk per trade. A VPS keeps the EA running every hour the market is open.

Input parameters

  • Ichimoku settings: Tenkan-sen period, Kijun-sen period, Senkou Span B period, and cloud confirmation on or off.
  • Entry settings: ATR period for the stop loss buffer, stop loss buffer beyond the Kijun-sen as an ATR multiple, skip the trade when the stop loss is wider than a set ATR multiple, and take profit as a multiple of the stop loss distance.
  • Trade settings: risk per trade in percent of balance, fixed lot size, magic number, maximum slippage, maximum spread and trade comment.
  • Alert settings: popup, push and email alerts, and a journal note for every skipped setup.

One system, done properly

Put KT Ichimoku Cross EA on USDJPY H1, leave the defaults where they are, and it trades the Ichimoku method exactly as it was tested.
More from author
KT Support and Resistance Levels MT5
KEENBASE SOFTWARE SOLUTIONS
5 (1)
KT Auto Support Resistance Levels: Multi-Timeframe S&R, Smart Zones and Levels Dashboard for MetaTrader 4/5 Swing highs. Pivots. Order blocks. Previous highs and lows. Every trader marks the market a little differently, and the chart pays the price. Stack enough methods on one screen and it stops being a map. It becomes noise. KT Auto Support Resistance Levels fixes that. It scans the monthly, weekly, daily, and your current timeframe at once, then draws the levels that actually matter directly
ACB Breakout Arrows MT5
KEENBASE SOFTWARE SOLUTIONS
3.5 (2)
Breakout Signals With Trade Context ACB Breakout Arrows detects a settling phase in price followed by a directional breakout and marks the setup with a buy or sell arrow. The arrow identifies a breakout pattern. It is not a promise that every signal will become a major move. A buy arrow highlights a bullish breakout setup, while a sell arrow highlights a bearish breakout setup. Because price can retest the breakout area or return inside the previous range, check the surrounding market structure,
ACB Trade Filter MT5
KEENBASE SOFTWARE SOLUTIONS
ACB Trade Filter answers one practical question before you place an order: is the market supporting this trade, or are you trying to force a signal through mixed conditions? The indicator reads market sentiment and trend, then presents the result through a color histogram and trend direction. Use it after your normal entry signal, not instead of one. Three market states at a glance Green histogram with bullish trend: conditions support looking for long setups from your strategy. Red histogram wi
KT Auto Support Resistance Levels: Multi-Timeframe S&R, Smart Zones and Levels Dashboard for MetaTrader 4/5 Swing highs. Pivots. Order blocks. Previous highs and lows. Every trader marks the market a little differently, and the chart pays the price. Stack enough methods on one screen and it stops being a map. It becomes noise. KT Auto Support Resistance Levels fixes that. It scans the monthly, weekly, daily, and your current timeframe at once, then draws the levels that actually matter directly
KT Stoch Divergence MT4
KEENBASE SOFTWARE SOLUTIONS
If you have ever watched price make a new high while Stochastic failed to confirm it, you already know why traders pay attention to divergence. KT Stoch Divergence marks these disagreements directly on the chart, so you can spot possible reversals and trend continuation setups without drawing every line by hand. The indicator finds both regular and hidden divergence between price and the Stochastic oscillator. It gives you context, not an automatic trade. You still decide whether the setup makes
ACB Breakout Arrows
KEENBASE SOFTWARE SOLUTIONS
4.15 (34)
Breakout Signals With Trade Context ACB Breakout Arrows detects a settling phase in price followed by a directional breakout and marks the setup with a buy or sell arrow. The arrow identifies a breakout pattern. It is not a promise that every signal will become a major move. A buy arrow highlights a bullish breakout setup, while a sell arrow highlights a bearish breakout setup. Because price can retest the breakout area or return inside the previous range, check the surrounding market structure,
ACB Trade Filter MT4
KEENBASE SOFTWARE SOLUTIONS
5 (1)
ACB Trade Filter answers one practical question before you place an order: is the market supporting this trade, or are you trying to force a signal through mixed conditions? The indicator reads market sentiment and trend, then presents the result through a color histogram and trend direction. Use it after your normal entry signal, not instead of one. Three market states at a glance Green histogram with bullish trend: conditions support looking for long setups from your strategy. Red histogram wi
KT Momentum Arrows
KEENBASE SOFTWARE SOLUTIONS
KT Momentum Arrows marks bullish and bearish momentum breakouts with arrows when a candle closes beyond its adaptive price bands. The bands respond to price deviation and changing volatility. A blue upward arrow confirms a close above the upper band, while a red downward arrow confirms a close below the lower band. The signal is fixed after the candle closes, so the arrow does not shift to another bar when you review the chart later. What the arrow is showing The arrow identifies the candle wher
KT COG Advanced MT4
KEENBASE SOFTWARE SOLUTIONS
1 (1)
KT COG is an advanced implementation of the center of gravity indicator presented by John F. Ehlers in the May 2002 edition of Technical Analysis of Stocks & Commodities magazine. It's a leading indicator which can be used to identify the potential reversal points with the minimum lag. The COG oscillator catches the price swings quite effectively. MT5 version of the same indicator is available here KT COG Advanced MT5 Calculation of COG The COG indicator is consist of the two lines. The main l
KT Pin Bar
KEENBASE SOFTWARE SOLUTIONS
KT Pin Bar identifies the pin bar formation which is a type of price action pattern which depicts a sign of reversal or rejection of the trend. When combined with support and resistance, BRN and other significant levels, Pin Bar pattern proved to be a very strong sign of reversal. Basically, a pin bar is characterized by a small body relative to the bar length which is closed either in upper or lower 50% part of its length. They have very large wicks and small candle body. A pin bar candlestic
KT Trend Magic
KEENBASE SOFTWARE SOLUTIONS
Read Trend Direction Directly on the Chart KT Trend Magic combines momentum and volatility into a color-coded line that follows price. The line gives you a continuous view of the active trend state and changes color when the calculated direction changes. Green line: shows a bullish trend state. Red line: shows a bearish trend state. Color change: marks a new directional transition on the chart. During a sustained move, the line can also serve as a dynamic chart reference for pullbacks and contin
KT Auto Fibo
KEENBASE SOFTWARE SOLUTIONS
Auto Fibonacci indicator that draws the Fibonacci retracement on the swing you are looking at, and redraws it the moment you zoom or scroll the chart. Zoom in on a pullback and the levels measure that pullback. Zoom out and they measure the whole trend. There are no anchor points to drag and no levels to redraw after every new high. Key features Measures the highest high and the lowest low on your screen, the current candle included. Follows zoom, scroll and window size at once, even when the ma
KT Psar Arrows
KEENBASE SOFTWARE SOLUTIONS
KT Psar Arrows plots the arrows on chart using the standard Parabolic SAR indicator. A bullish arrow is plotted when the candle's high touch the SAR. A bearish arrow is plotted when the candle's low touch the SAR. The signals are generated in the real-time without waiting for the bar close.  Features A beneficial tool for traders who want to experiment with the trading strategies that include the use of Parabolic Sar indicator.  Can be used to find turning points in the market. Use custom PSAR
KT Ichimoku Trader
KEENBASE SOFTWARE SOLUTIONS
1 (1)
Five Ichimoku strategies, traded automatically KT Ichimoku Trader is an Expert Advisor that opens and closes trades automatically with five classic Ichimoku Kinko Hyo strategies. You switch on the strategies you want, and each one trades on its own: its own entry rules, its own exit rules, and at most one open trade per strategy at a time. Every entry is checked on a closed candle. When a new candle opens, the EA reads the candle that just closed and opens a trade only when every entry rule of t
KT Volatility Oscillator
KEENBASE SOFTWARE SOLUTIONS
KT Volatility oscillator analyze the past and current market data with a mathematical formula to display the result in a form of an oscillator. The growing and deteriorating waves are equivalent to high and low volatility in the asset.  In a nutshell, volatility is simply a measurement of the price fluctuation of an asset over a certain period of time. Without volatility, there would not much movement in the market and traders would not be able to profit from the price movements. Use of Volatil
KT COG Robot
KEENBASE SOFTWARE SOLUTIONS
KT COG Robot is a fully automated Expert Advisor based on the KT COG Indicator . The COG indicator was originally presented by John F. Ehlers in the May 2002 edition of Technical Analysis of Stocks & Commodities magazine. The EA fires a long trade when COG line cross above the signal line and a short trade is fired when the COG line cross below the signal line.  Adaptive Filtration Our adaptive filtration algorithm combines the original COG formula with the major trend direction and market acce
ACB Breakout Arrows EA
KEENBASE SOFTWARE SOLUTIONS
Automate the ACB Breakout Workflow ACB Breakout Arrows EA evaluates breakout signals on the attached chart and manages trades with the built-in ACB Breakout Arrows and ACB Trade Filter logic. Attach the EA to the symbol and timeframe you want it to monitor, enable automated trading, then choose the position, session, filter and exit rules that fit your test plan. The required indicators and dependencies are embedded in the EA, so no separate download is needed. Their panels are not displayed on
KT Asian Breakout
KEENBASE SOFTWARE SOLUTIONS
4 (1)
KT Asian Breakout carefully analyzes the range-bound market during the Asian session and then fires a long or short trade after doing some preassessment based on its inbuilt technical analysis module. The executed orders are closed within a day before the completion of the next day session. The inbuilt technical analysis module checks for the session range and compares it with the last 20 days price movement. If it finds any erratic price movement within the session, the orders are not executed
KT London Breakout
KEENBASE SOFTWARE SOLUTIONS
First thirty minutes are essential for a trading session. The early reaction of traders and market players sets a path for the rest of the day. KT London Breakout EA takes advantage of this phenomenon, and after analyzing the first thirty minutes of London session, it places two bidirectional pending orders. One of pending order is eventually canceled after realizing the market direction with certainty. It has been strictly tested and developed for EUR/JPY using 30-Min Time Frame. You can expe
Currency strength and pair correlation in one indicator KT Currency Strength and Correlation ranks the eight major currencies from strongest to weakest and shows, in a colored matrix, how closely ten currency pairs of your choice move together. Before you open a trade from your own strategy, you can check whether the two currencies of the pair are really moving apart, and whether the new trade adds risk to a trade you already hold. What you see on the chart Strength lines: a separate window belo
MACD Divergence Seeker
KEENBASE SOFTWARE SOLUTIONS
KT MACD Divergence Seeker trades the regular and hidden divergence signals generated by our free indicator named KT MACD Divergence indicator. Trading the standalone divergences can be a risky affair that's why the KT MACD Divergence Seeker combines the standard divergence signals with an advanced analysis module to exploit the price inefficiencies on some FX pairs. What is the Divergence exactly? As a general conception if the price is making higher highs, then macd should also be making hig
KT Asian Breakout Indicator
KEENBASE SOFTWARE SOLUTIONS
Map the Asian Session Range KT Asian Breakout Indicator marks the high and low of a four-hour Asian-session window and watches price after the range is complete. The GMT Offset setting aligns the session with your broker's server time, while Draw Session Box controls the visible range. See the Breakout and Trade Levels Together A bullish arrow appears when price closes above the session high. A bearish arrow appears when price closes below the session low. When Draw Stoploss and Profit Targets i
MACD Divergence MT4
KEENBASE SOFTWARE SOLUTIONS
KT MACD Divergence shows the regular and hidden divergences build between the price and oscillator. If your trading strategy anticipates the trend reversal, you can include the MACD regular divergence to speculate the potential turning points. And if your trading strategy based on the trend continuation, MACD hidden divergence would be a good fit. Limitations of KT MACD Divergence Using the macd divergence as a standalone entry signal can be a risky affair. Every divergence can't be interprete
KT Bollinger Bands Trader MT4
KEENBASE SOFTWARE SOLUTIONS
KT Bollinger Bands Trader is a 100% automated expert advisor that's incorporated a mean reversion trading strategy using the Bollinger bands during the period of low volatility. Price often reacts at the upper or lower line of Bollinger bands, but a reversal not always occurs. However, there is more chance of price reversal during the time of low volatility. Entries A buy trade is activated when price correctly aligns below the bottom line of Bollinger bands. A sell trade is activated when pric
KT CCI Divergence MT4
KEENBASE SOFTWARE SOLUTIONS
KT CCI Divergence shows the regular and hidden divergence created between the price and CCI oscillator. Divergence is one of the vital signals that depicts the upcoming price reversal in the market. Manually spotting the divergence between price and CCI can be a hectic and ambiguous task. Limitations of KT CCI Divergence   Using the CCI divergence as a standalone entry signal can be risky. Every divergence can't be interpreted as a strong reversal signal. For better results, try to combine it w
KT Heiken Ashi Smoothed MT4
KEENBASE SOFTWARE SOLUTIONS
Follow the Smoothed Heiken Ashi State KT Heiken Ashi Smoothed turns price movement into smoothed blue and red candles. It adds a blue up arrow when the state changes from bearish to bullish and a red down arrow when the state changes from bullish to bearish, making directional transitions easy to see on the chart. The smoothing period and smoothing method control how strongly the candles are smoothed. This provides a steadier view than standard Heiken Ashi while letting you choose the response t
KT MA Crossover MT4
KEENBASE SOFTWARE SOLUTIONS
KT MA Crossover draws the buy and sell arrows based on the crossover of chosen moving averages. Moreover, it also generates the appropriate alerts and displays the MFE (Most Favorable Excursion) for each successive signal. The moving average crossover is one of the primary strategies followed by traders around the world. Usually, it consists of a fast and slow moving average to find a buy and sell entry signal according to the crossover direction. Buy signal - when fast MA crosses above the slo
KT Round Numbers MT4
KEENBASE SOFTWARE SOLUTIONS
KT Round Numbers plots the round number levels which are also commonly known as psychological levels in the Forex world. In the context of Forex trading, round number levels are those levels in which there are two or more zeroes at the end. They are named as 00 levels on the chart. Some traders also consider the halfway points as a valid round number level. They are named as 50 levels on the chart. Use of round number levels in trading Round number levels work as strong support and resistance
KT Inside Bar Advanced MT4
KEENBASE SOFTWARE SOLUTIONS
Despite the popularity of inside bar pattern among the traders, using it as a standalone signal doesn't provide any edge in the market. KT Inside Bar Advanced indicator solves this problem by combining the classic inside bar pattern with the "ECE" cycle and Fibonacci extensions. Using this indicator in place of our classic inside bar indicator will provide a tremendous advantage and edge in the market. What is the ECE cycle? In financial markets, the price never moves in a straight line but u
KT Inside Bar Hunter MT4
KEENBASE SOFTWARE SOLUTIONS
Despite the popularity of inside bar pattern among traders, using it as a standalone entry signal doesn't provide any evidentiary advantage. KT Inside Bar Hunter trades only selected inside bar patterns using some preassessment and ECE price action cycle. Trading Strategy On successful detection of the required pattern, EA places a pending order in the direction of the forecasted price expansion phase. Pending orders are canceled if they are not triggered within the next bar. Once triggered, ac
Filter:
No reviews
Reply to review





















