Market Condition Evaluation based on standard indicators in Metatrader 5 - page 178
You are missing trading opportunities:
- Free trading apps
- Over 8,000 signals for copying
- Economic news for exploring financial markets
Registration
Log in
You agree to website policy and terms of use
If you do not have an account, please register
Forum on trading, automated trading systems and testing trading strategies
Press review
Sergey Golubev, 2016.06.14 08:45
Trading News Events: U.K. Consumer Price Index (adapted from the article)- "A pickup in the headline & core U.K. Consumer Price Index (CPI) may spark a near-term rebound in GBP/USD as it puts pressure on the Bank of England (BoE) to normalize monetary policy sooner rather than later."
- "Even though the economic outlook remains clouded by the U.K. Referendum on June 23, signs of heightening price pressures may encourage the BoE to adopt a more hawkish tone for monetary policy as Governor Mark Carney and Co. see a risk of overshooting the 2% inflation-target over the policy horizon."
What’s Expected:===
GBP/USD Technical Analysis: daily bearish breakdown, intra-day ranging bearish
GBPUSD D1: bearish breakdown. The daily price is on bearish market condition: price broke Ichimoku cloud to below for good breakdown with 1.4130 support level. Absolute Strength indicator and Trend Strength indicator are estimating the bearish trend to be continuing.
If the price breaks 1.4130 support to below on close D1 bar so the bearish breakdown will be continuing.
If the price breaks Senkou Span line at 1.4480 to above so the reversal of the price movement to the primary bullish condition will be started.
If not so the price will be on ranging bearish within the levels.
GBPUSD H4: bearish ranging within narrow levels. The price is on bearish condition for the ranging within narrow support/resistance levels: 1.4130 support and 1.4327 resistance.
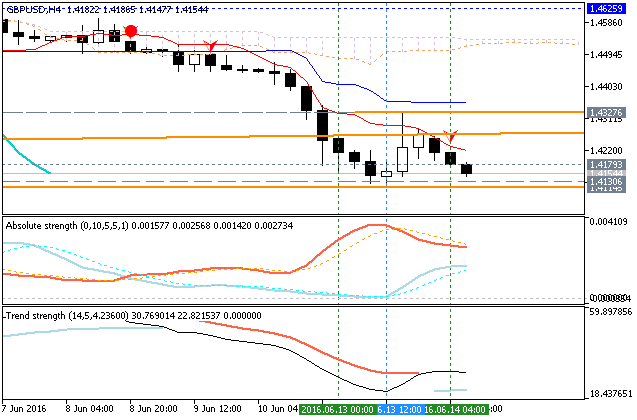
If the price breaks 1.4130 support to below on close H4 bar so the bearish trend will be continuing.If the price breaks 1.4327 resistance to above so the local uptrend as the bear market rally will be started.
If not so the price will be on ranging bearish within the levels.
Forum on trading, automated trading systems and testing trading strategies
Forecast for Q2'16 - levels for GBP/USD
Sergey Golubev, 2016.06.14 08:53
GBP/USD M5: 36 pips range price movement by U.K. CPI news event
Forum on trading, automated trading systems and testing trading strategies
Forecast for Q2'16 - levels for S&P 500
Sergey Golubev, 2016.06.15 09:28
S&P 500 - Long-Term Forecast: ranging near 100 SMA for the correction to be started or for the bullish trend to be continuing
S&P 500 Weekly: ranging within bullish levels. The weekly price located fare above 200 SMA for the bullish market condition: price broke 100 SMA to be reversed from the ranging bullish to the primary bullish market condition with 2119.25 resistance as a nearest bullish target.
Forum on trading, automated trading systems and testing trading strategies
Forecast for Q2'16 - levels for DAX Index
Sergey Golubev, 2016.06.16 10:42
DAX Index Technical Analysis: daily bearish breakdown; weekly ranging near bearish reversal
Daily price is on breakdown since the middle of the last week: the price broke 100 SMA/200 SMA reversal area for the primary bearish market condition. The price is breaking 9,503.6 support level to below together with descending triangle pattern for the 9,420.8 level as a nearest bearish target for the primary bearish breakdown to be continuing.
If D1 price will break 9,420.8 support level on close bar so the primary bearish trend will be continuing.
If D1 price will break 10,100.0 resistance level on close daily bar from below to above so the reversal of the price movement from the ranging bearish to the primary bullish condition will be started.
If not so the price will be on bearish ranging within the levels.
SUMMARY : breakdown
TREND : bearishForum on trading, automated trading systems and testing trading strategies
Press review
Sergey Golubev, 2016.06.16 11:00
Trading News Events: U.S. Consumer Price Index (CPI) (adapted from the article)"The U.S. Consumer Price Index (CPI) increased an annualized 1.1% in April following the 0.9% expansion the month prior, while the core rate of inflation narrowed to 2.1% from 2.2% during the same period. A deeper look at the report showed transportation costs climbing another 0.7% on the back of higher energy prices, which was accompanied by a 0.2% rise in food costs, while prices for apparel slipped 0.3% in April. The U.S. dollar struggled to hold its ground following the slowdown in core inflation, with EUR/USD bouncing back from the 1.1300 handle to end the day at 1.1309."
What’s Expected:
EUR/USD H4: bearish ranging near bullish reversal. The H4 price is located inside Ichimoku cloud for the ranging market condition waiting for the direction of the trend to be established. Ascending triangle pattern was formed by the price to be crossed to above for the possible bullish reversal, and Absolute Strength indicator together with Trend Strength indicator are estimating the possible bullish trend to be started in the near future.
If H4 price breaks 1.1298 resistance level to above so the reversal of the price movement from the ranging bearish to the primary bullish market condition will be started: the price will cross uppper Senkou Span line to below.
If H4 price breaks 1.1188 support level to below so the primary bearish trend will be resumed.
If not so the price will be on bearish ranging condition.
Forum on trading, automated trading systems and testing trading strategies
Press review
Sergey Golubev, 2016.06.17 11:41
Trading News Events: Canada Consumer Price Index (CPI) (adapted from the article)
H4 price is located near SMA with period 100 (100-SMA) and SMA with the period 200 (200-SMA) waiting for the direction for the possible breakout or breakdown.
SUMMARY : ranging
TREND : waiting for directionForum on trading, automated trading systems and testing trading strategies
Forecast for Q2'16 - levels for SILVER (XAG/USD)
Sergey Golubev, 2016.06.18 17:44
SILVER (XAG/USD) Technical Analysis 2016, 19.06 - 26.06: intra-day/daily/weekly ranging bullish, monthly ranging bearish
Daily price is located to be above Senkou Span line in the bullish area. The price is on ranging within the following key support/resistance levels:
Chinkou Span line crossed the price many times in different direction for the possible ranging trend to be continuing, Trend Strength indicator is estimating the bullish condition in the near future, and Absolute Strange indicator is evaluating the local downtrend as a secondary correction for the price to be established soon.
If D1 price will break 16.22 support level on close bar so the reversal of the price movement from the ranging bullish to the primary bearish market condition will be started with 15.80 level as a nearest bearish target.

If D1 price will break 17.84 resistance level on close bar from below to above so the primary bullish trend will be continuing.
If not so the price will be on ranging within the levels.
SUMMARY : ranging bullish
TREND : rangingForum on trading, automated trading systems and testing trading strategies
Forecast for Q2'16 - levels for NZD/USD
Sergey Golubev, 2016.06.19 08:49
NZDUSD Technical Analysis 2016, 19.06 - 26.06: bullish ranging with symmetric triangle pattern for the bullish continuation or the bearish reversal
Daily price is located above Ichimoku cliud for the bullish market condition. The price is on ranging within the following support/resistance levels:
Symmetric triangle pattern was formed by the price to be crossed for direction, and Absolute Strength indicator is estimating the trend as the ranging condition in the near future.
If D1 price will break 0.6891 support level on close bar so the reversal of the price movement from the primary bullish to the ranging bearish market condition will be started.
If D1 price will break 0.7146 resistance level on close bar from below to above so the bullish trend will be continuing.
If not so the price will be on ranging within the levels.
SUMMARY : bullish
TREND : rangingForum on trading, automated trading systems and testing trading strategies
Forecast for Q2'16 - levels for GOLD (XAU/USD)
Sergey Golubev, 2016.06.19 17:49
GOLD (XAU/USD) Technical Analysis 2016, 19.06 - 26.06: 100-day high at 1314.55 is going to be testing for the bullish trend to be continuing
Daily price is located above 100 SMA/200 SMA for the bullish market condition with the ranging within the following key support/resistance levels:
Descending triangle pattern was formed by the price to be crossed for the possible bearish reversal to be started.
If D1 price will break 1234.70 support level on close bar so the local downtrend as a secondary correction within the primary bullish trend will be started.

If D1 price will break 1199.64 support level on close bar so we may see the bearish reversal to be started with 100-day low at 1115.42 as a good bearish target.
If D1 price will break 1306.67 resistance level on close bar so the bullish trend will be continuing with 100-day high at 1314.55 target to re-enter.
If not so the price will be on ranging within the levels.
Forum on trading, automated trading systems and testing trading strategies
Forecast for Q2'16 - levels for S&P 500
Sergey Golubev, 2016.06.20 17:47
S&P 500 Technical Analysis 2016, 19.06 - 26.06: ranging bullish
Daily price was on local uptrend as the secondary correction within the primary bullish market condition since 12th of June this year: price broke Ichimoku cloud to below on open daily bar and it was bounced back to bullish area from 2049.75 support level. For now, the price is on ranging within the following s/r levels:
- 2119.25 resistance level located above Ichimoku cloud in the bullish area of the chart, and
- 2049.75 support level located near and below Ichimoku cloud in the beginning of the bearish area.
Absolute Strange indicator is estimating the price movement as the secondary ranging condition to be started.If D1 price breaks 2049.75 support level on close bar so the bearish reversal will be started with 2021.75 level as a possible bearish target.
If D1 price will break 2119.25 resistance level on close bar from below to above so the primary bullish market condition will be continuing.
If not so the price will be on ranging within the levels.
SUMMARY : bullish
TREND : rangingForum on trading, automated trading systems and testing trading strategies
Press review
Sergey Golubev, 2016.06.22 14:42
USD/CAD Intra-Day Fundamentals: Canada Retail Sales and 34 pips price movement
2016-06-22 12:30 GMT | [CAD - Retail Sales]
if actual > forecast (or previous one) = good for currency (for CAD in our case)
[CAD - Retail Sales] = Change in the total value of sales at the retail level.
==========
==========
USD/CAD M5: 34 pips price movement by Canada Retail Sales news event
==========
USD/CAD M5: the price is on bearish breakdown by breaking key support levels together with descending triangle pattern to below for the intra-day bearish trend to be continuing.
If the price breaks 1.2741 support level to below on close M5 bar so the bearish breakdown will be continuing, otherwise - ranging bearish.