From theory to practice - page 1601
You are missing trading opportunities:
- Free trading apps
- Over 8,000 signals for copying
- Economic news for exploring financial markets
Registration
Log in
You agree to website policy and terms of use
If you do not have an account, please register
This is how people trade.
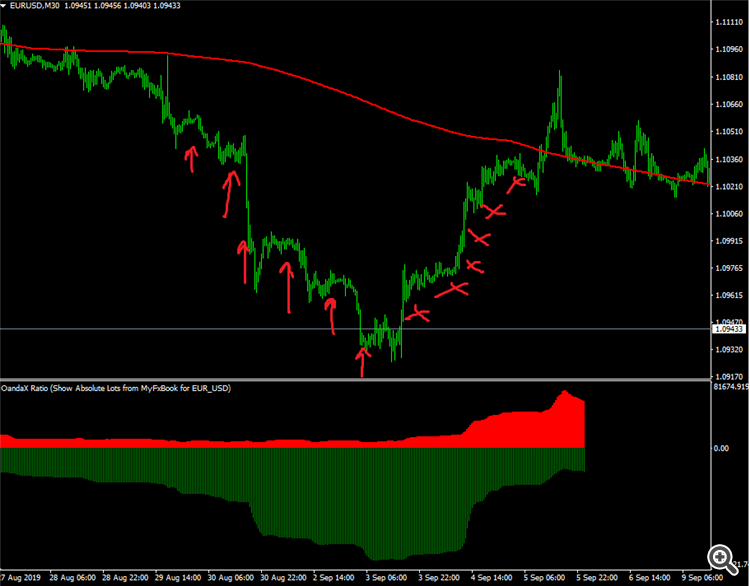
When the price moves down, they open many small buy trades as the price moves.
When the price starts to move back, they slowly and systematically close them.
arrows - deals. crosses - closing deals.
On the basement indicator green bars - the number of buys in the market.
Why does this happen?
I have several versions about it.
1) People open a grid of orders when the price moves away from the wrist. And when price starts to move back, they slowly close that grid of orders.
But here a question arises. Why the slow closing of orders on the way back to the mask? Why not wait for the price to cross the wrist and close them all?
Then we would see on the basement indicator a sharp fall of the number of bugs to zero when the price touches the mashka.
Why is there a slow closure of trades on the return? Maybe people just trade on different wristbands, that is why they open at different levels on the deviation and, consequently, they close at different levels on the comeback.
I don't know such a popular strategy, where there is a systematic build-up of grid orders, and then, on the move back, there is the same smooth closing of trades, from level to level...
But anyway, closings would be more rare than openings (many trades are opened and then they all are closed at the same time). And here there are as many open trades as there are closes.
2) The second version is this. People do not like to close at a loss. A person, when he is at a loss, waits for the price to return to the opening level to close at zero.
Perhaps, all these deals that are shown with arrows are deals of traders who at this moment decided "Oh, the price has deviated a bit, now it will return".
But they decided it all at different price levels. Somebody needed 25 points, somebody needed 50, and somebody needed 100 to make this decision.
After opening a trade, they started to go into a drawdown, but decided not to close until the price came back. to close at zero.
and all of these (red crosses) are levels where different traders closed at zero.
these are my theories on the analysis of the crowd behaviour chart.
this is how people trade
when price moves down, they open a lot of small buy trades, on the move.
When the price starts to move back - they slowly and systematically close them.
Simply, normal people trade on the trend. Lots of small stops and some big takes (one take, but it's a secret).
this is how people trade.
these are my theories on the analysis of the crowd behaviour chart.
this is how speculators trade
you don't understand your questions until you find formulae
this is how people trade
when price moves down, they open a lot of small buy trades, on the move.
When the price starts to move back - they slowly and systematically close them.
Simply, normal people trade on the trend. Lots of small stops and some big takes (one take, but that's a secret).
Here's how people trade.
When the price moves down, they open many small buy trades.
When the price starts moving back up, they slowly and systematically close them.
arrows - deals. crosses - closing deals.
On the basement indicator green bars - the number of buys in the market.
Why does this happen?
I have several versions about it.
1) People open a grid of orders when the price moves away from the swing. And when the price starts moving back, they slowly close this grid of orders.
But here a question arises. Why the slow closing of orders on the way back to the mask? Why not wait for the price to cross the wrist and close them all?
Then we would see on the basement indicator a sharp fall of the number of bugs to zero when the price touches the mashka.
Why is there a slow closure of trades on the return? Maybe people just trade on different wristbands, that is why they open at different levels on the deviation and, consequently, they close at different levels on the comeback.
I don't know such a popular strategy, where there is a systematic build-up of grid orders, and then, on the move back, there is the same smooth closing of trades, from level to level...
Except for Ilan, where closings are based on the total profit of the grid. But anyway, closings would be more rare than openings (many trades are opened there and then they all are closed at the same time). And here there are as many open trades as there are closes.
2) The second version is this. People do not like to close at a loss. A person, when in a loss, waits for the price to return to the opening level to close at zero.
Perhaps, all these deals that are shown with arrows are deals of traders who at this moment decided "Oh, the price has deviated a bit, now it will return".
But they decided it all at different price levels. For some traders 25 pips, for others 50 or even 100 pips were enough to make this decision.
After opening the trade, they started to go into drawdown, but decided not to close until the price returned to close at zero.
and all of these (red crosses) are levels where different traders closed at zero.
these are my theories on the analysis of the crowd behaviour chart.
Why should you see the stupidity of the crowd in the sub-window as well. I, for one, have enough of my own.
there's percentages.
60, 40 is the beginning of the deal
visually tested, doesn't seem to be stupid
good for starters
that's how speculators trade.
you don't understand your questions until you find the FormulaE
that's how speculators trade
You can't understand your questions until you find the Formulae.
"Why should you see the stupidity of the crowd in the sub-window as well. I, for one, have enough of my own."
You don't have to sort it out, it's no use anyway.
As the trades of home traders have no effect on the market at all.
Well, the market maker will not drive the price down 200 pips against the retail crowd, down 300 pips, IF at the same time the real market is going up (trillion dollar corporations, exporters-importers, central bankers).
home traders are small fish in the sea. they are even leveraged to market makers now.
because market makers now provide leverage to forex brokers.
Let's count the volume of retail traders.
There are 1 million traders in the world. The average deposit is $1000. Total volume of retail traders' money is 1 billion dollars.
and this 1 billion is leveraged.
And the volume of the interbank forex market is $7 trillion/day. 7,000 times that!
MM doesn't change the price, depending on retail traders' trades.
MM serves the retail market at the current price of the interbank forex market, plus leverage.
I concede MM can fluctuate the price up and down finely by a few pips to knock the stops off for those traders who put them close.
But for that to happen ALL the market makers need to collude, and there are 10 of them, and they themselves compete with each other in the forex broker's stack, trying to offer the best price.
for them to collude - it is unlikely.
Come on, Renat, we saw your formula on monitoring)
as written here above:
"Why should you see the stupidity of the crowd in the sub-window as well. I, for one, have enough of my own."
It doesn't have to be sorted out, it's no use anyway.
As the trades of home traders have no effect on the market at all.
A market maker will not push the price down 200 pips, 300 pips, against the retail crowd, IF the real market is going up (trillion-dollar corporations, exporters-importers, central bankers).
home traders are small fish in the sea. they are even leveraged out to market makers now.
because market makers now provide leverage to forex brokers.
Let's count the volume of retail traders.
There are 1 million traders in the world. The average deposit is $1000. The total amount of retail traders' money is $1 billion.
And this $1 billion is transferred to mm without leverage.
And the volume of the interbank forex market is $7 trillion/day. 7,000 times that!
MM doesn't change the price depending on what trades from retail traders come into it.
MM serves the retail market at thecurrent price that currently exists on the interbank forex market.
I concede the MM may fluctuate the price up and down a few pips to knock the stops off for those traders who put them close.
BUT! to do that you need ALL the market makers to collude. and there are 10 of them out there, and they themselves compete with each other in the forex broker's stack, trying to offer the best price.
for them to collude is unlikely.
Why make obscure calculations?
Can't you use a ready-made indicator?
Try using this "ready-made" indicator in your EA )
I have several theories on this.
1) People open a grid of orders when price moves away from the wrist. And when price starts to move back, they slowly close that grid of orders.
Why is there a slow closing of trades when there is a move back? Maybe, people trade by different wands and that is why they open at different levels during deviation and close at different levels during the comeback move.
2) The second version is this. People do not like to close at a loss. A person, when in a loss, waits for the price to return to the opening level to close at zero.
I'm leaning more towards the first version. because, I've checked, on the flat the "crowd" makes money, on the trend it pours.
And this is why there may be a close at different levels:
If we draw the wands of different periods on the chart.
200, 300, 400.
The openings will start approximately at one point, but the closings will be at different points.