OpenCL: internal implementation tests in MQL5 - page 29
You are missing trading opportunities:
- Free trading apps
- Over 8,000 signals for copying
- Economic news for exploring financial markets
Registration
Log in
You agree to website policy and terms of use
If you do not have an account, please register
...
--
Make 512 and see what you get. Don't be afraid of crunching the program, it'll only make it better. :) When you've done it, post it here.
OK! At 512 passes and 144000 bars:
Well and if 60 is optimal, then generally cool:
//---
That is, on the weakest laptop presented in this thread, this is the result. So very promising.
//---
Unfortunately, I'm unable to discuss the subject freely, as I haven't even got into the joo article and neural networks, while I've never dug around to OpenCL. I can't use this or that code without understanding every single line of code. I want to know everything. ))) I am still working on the trading program engine. There's so much to do that my head is already swirling. )))
Increased CountBars by a factor of 30 (to 4,320,000), decided to test the stone's resistance to load.
Doesn't matter: it works, it warms up, but it doesn't sweat too much. The temperature is slowly rising, but has already reached saturation.
The red line is the temperature, the green line is the load of the cores.
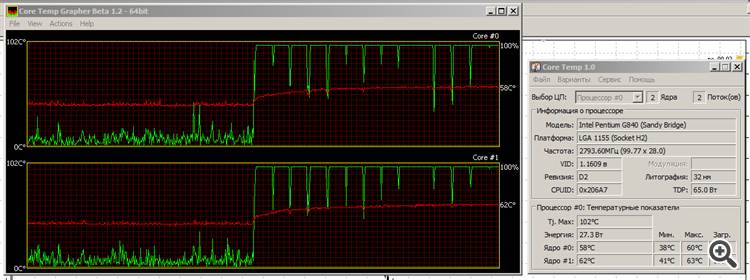
That's why I love Intel's Sandy Bridge specimen: it's "green". Yes, the graphics aren't great, but we'll see what Ivy Bridge becomes......
That's why I love Intel's Sandy Bridge model: it's "green". Yeah, the graphics aren't great, but we'll see what Ivy Bridge becomes...Oh. (chuckles) Now that's a real stress test. :) Mine would probably be dead by now.
Then what a Haswell and then a Rockwell a little later... )))
An example of a Barnsley fern implementation in OpenCL.
The calculation is based on the Chaos Game algorithm(example) and uses a random number generator with a generation base that depends on the thread ID and returns get_global_id(0) to create unique trajectories.
As you scale, the number of points required to maintain image quality grows quadratically, so this implementation assumes that each of the kernel instances will render a fixed number of points that fall within the visible area.
The number of estimated threads is specified on line 191:
the number of points is in line 233:
UPD
IFS-fern.mq5 - CPU analogue
At scale=1000:
I have made three-layer of 16x7x3 neurons. Actually, I've made it the day before yesterday, debugged it today. Before that the results did not fit when checking with CPU - I won't describe here the reasons why, at least not now - I'm too sleepy. :)
Temporal characteristics :
Tomorrow I will make Optimizer for this grid. Then I will busy loading real data and finishing the tester up to realistic calculations verifiable with MT5-tester. Then I will deal with generator MLP+cl-codes of grids for their optimization.
I don't post the source code because of greed, but ex5 is included for those who would like to test it on their hardware.
I'm as stable as I was under Putin:
2012.03.08 05:38:22 ParallelTester_00-02-j16x7x3z (EURUSD,H1) CpuTime/GpuTime = 24.08037178786222
2012.03.08 05:38:22 ParallelTester_00-02-j16x7x3z (EURUSD,H1) Result on Cpu МахResult==1.09311 at 771 pass
2012.03.08 05:38:22 ParallelTester_00-02-j16x7x3z (EURUSD,H1) Соunt inticators = 16; Count history bars = 144000; Count pass = 1024
2012.03.08 05:38:22 ParallelTester_00-02-j16x7x3z (EURUSD,H1) CPU time = 176172 ms
2012.03.08 05:35:26 ParallelTester_00-02-j16x7x3z (EURUSD,H1) Result on Gpu МахResult==1.09311 at 771 pass
2012.03.08 05:35:26 ParallelTester_00-02-j16x7x3z (EURUSD,H1) Соunt inticators = 16; Count history bars = 144000; Count pass = 1024
2012.03.08 05:35:26 ParallelTester_00-02-j16x7x3z (EURUSD,H1) GPU time = 7316 ms
2012.03.08 05:35:18 ParallelTester_00-02-j16x7x3z (EURUSD,H1) OpenCL init OK!
By the way, pay attention: by CPU runtime the difference between your system and mine (based on Pentium G840) is not so big.
Is your RAM fast? I have 1333 MHz.
One more thing: it's interesting that both cores are loaded on the CPU during computations. The sharp drop in load at the end is after the end of the calculations. What would that mean?
I'm as stable as under Putin:
2012.03.08 05:38:22 ParallelTester_00-02-j16x7x3z (EURUSD,H1) CpuTime/GpuTime = 24.08037178786222
2012.03.08 05:38:22 ParallelTester_00-02-j16x7x3z (EURUSD,H1) Result on Cpu МахResult==1.09311 at 771 pass
2012.03.08 05:38:22 ParallelTester_00-02-j16x7x3z (EURUSD,H1) Соunt inticators = 16; Count history bars = 144000; Count pass = 1024
2012.03.08 05:38:22 ParallelTester_00-02-j16x7x3z (EURUSD,H1) CPU time = 176172 ms
2012.03.08 05:35:26 ParallelTester_00-02-j16x7x3z (EURUSD,H1) Result on Gpu МахResult==1.09311 at 771 pass
2012.03.08 05:35:26 ParallelTester_00-02-j16x7x3z (EURUSD,H1) Соunt inticators = 16; Count history bars = 144000; Count pass = 1024
2012.03.08 05:35:26 ParallelTester_00-02-j16x7x3z (EURUSD,H1) GPU time = 7316 ms
2012.03.08 05:35:18 ParallelTester_00-02-j16x7x3z (EURUSD,H1) OpenCL init OK!
1. By the way, notice the difference between your system and mine (Pentium G840 based) in CPU execution time.
2. Is your RAM fast? I have 1333 MHz.
1. I've been restoring my overclocking in my spare time. I once had a really bad crash (I found out later that the drive power cord had fallen out), so I pressed the "MemoryOK" button on the motherboard in search of a miracle. After that, it still didn't work, only the CMOS settings were reset to default. Now, I've overclocked the processor to 3840 MHz again, so it's working smarter now.
2. Still can't figure it out. :) In particular, the benchmark, to which Renat showed the link, shows 1600MHz. The Windows even show 1033MHz :)))), in spite of the fact that the memory itself is 2GHz, but my mother can pull up to 1866 (figuratively).
One more thing: it's interesting that I have both cores loaded when calculating on CPU. The sharp drop in load at the end is after the end of calculations. What would it mean?
So maybe it's not on GPU at all? The driver is up, but... My only explanation is that the calculation is done on CPU-OpenCL, only, of course, on all available cores and using vector SSE instructions. :)
The second variant is that it counts simultaneously on CPU and CPU. I don't know how this (CPU-LPU) support is implemented by the driver, but in principle I don't exclude such a variant of opentzl processing startup as well.
This is my speculation, if anything. Or as it is fashionable to write now - "IMHO". ;)
I doubt it. Especially since I only have two cores. Where does the 25x profit come from then?
If you have Intel Math Kernel Library or Intel Performance Primitives (I haven't downloaded them), it's possible... in some cases. But it's unlikely, since they weigh hundreds of meg.
I'll have to see what Google has to say about it.
Mathemat: Also, interestingly enough, my CPU computations have both cores loaded.
No, I meant pure CPU computation without any OpenCL. The load is just below 100% where each core has comparable load values. But when running OpenCL code, it goes up to 100%, which can easily be explained by GPU operation.