Something interesting, old thread - page 126
You are missing trading opportunities:
- Free trading apps
- Over 8,000 signals for copying
- Economic news for exploring financial markets
Registration
Log in
You agree to website policy and terms of use
If you do not have an account, please register
mqh file please for include/expert/signal
Kancho
That indicator does not have include files. That is metatrader 5 indicator and it works OK when compiled and attached to chart
Mr Sergey, firstly I wan to thank you for sharing the Guppy MMA, I like the info its display on the top right corner, is there by any chance that this indicator exist in mq4 for MT4?
Mr Sergey, firstly I wan to thank you for sharing the Guppy MMA, I like the info its display on the top right corner, is there by any chance that this indicator exist in mq4 for MT4?
Chris
That would be this one :)
Chris
That would be this one :)
Thank you Mr Mladen, I really appreciate :-)
Too large account drawdown and too much risk on the capital ... how to deal with it?
read the following articles:
--------------------
Forum on trading, automated trading systems and testing trading strategies
Advanced links/threads/tools
Sergey Golubev, 2012.08.24 09:37
Multi-Dimensional Fractals & Fractal Channel
Forum threads
Multi-Dimensional Fractals (up to 4 Dimension) give us market structure with different kinds of supports and resistances and Multi-Dimensional Fractal Channel - for more precise undestanding of market structure.
The articles
CodeBase
============
Composite Fractal Behavior (CFB)
CFB tells you how long the market has been in a quality trend. This value can be used to adjust the period length of other indicators, especially stochastic bands. In order to quantify the overall duration of a market's trend, we replaced classical cycle analysis methods (FFT, MEM, MESA) with a form of analysis that works even when no cycles exist. We accomplished this by examining a time series for specific fractal patterns of any size. We then gather all the patterns found and combine them into one overall index, CFB (Composite Fractal Behavior) Index.
Composite Fractal Behavior and its aplications - good thread with the following indicators:
============
Fractals MTF alerts
It is very advanced multi timeframe fractal indicator with alerts. There are some good features such as how to show the arrows when showJustOneArrow parameter is set to true :
showArrowType parameter :
0 -> draw arrow just on the first bar of the target time frame
1 -> draw arrow just on the last bar of the target time frame
2 -> draw arrow when the high is equal to high fractal or low is equal for low fractal
Additional option is to show the arrow just on the first bar of the target time frame fractal, or to repeat it on every bar belonging to that time frame bar.
Forum on trading, automated trading systems and testing trading strategies
Press review
Sergey Golubev, 2017.10.29 07:28
How To Trade - Fractal Indicator and How Does It Work (based on blog post)
The fractals are technical indicators, part of the Bill Williams’ indicators. Unlike any other indicators, this one is not a line or histogram bars; it is just a simple arrow on top of or below the bars of the price chart. These fractals are formed when five consecutive bars align in a strict manner. There are two types of fractals:
Bearish fractals: this fractal forms over a bar in the price chart, only if the high of this bar is higher than the high of the previous two and next two bars. In real-life trading this fractal indicates a possible bearish movement.
Bullish fractals: this fractal forms below a bar in the price chart, if the low of this bar is lower than the low of the previous two and next two bars. When you see this fractal, you should expect a bullish movement.
It is important to mention that the Bill Williams’ fractals are illustrated a bit late on the chart, because you need the fifth bar to close, in order to determine the highest high or lowest low. The fractals are trading signals, but they are far too insufficient to count on them alone: the buy fractal indicates a possible buy order and vice versa.
The fractals point out the strong levels. You can easily draw a line to connect multiple fractals to form either a resistance or a support line. These levels work exactly the same as the trend lines. If you take a look at the image, you will see the resistance line and the buy signal. We get this signal, because the price breaks the strong resistance level. However, if you take a close look at the chart before this moment, you will see a couple of sell signals. This clearly points out how inconclusive are the fractals alone.
If you have paid attention on the Trend Lines page, you already know that some traders use the fractals to build their trend line. We really like this strategy, but it is not something revolutionary.
Bill Williams’ fractals and Alligator indicator. These two indicators share great synergy and we will take a quick glance in the image. It is the same as the previous, but we have added the Alligator and this changes the picture quite a lot. Take a look at the buy signal; do you see now why we have not opened a sell order before the buy signal? The price moved above the Alligator and we needed to see a breach of the indicator’s levels and a couple of sell fractals, but did not see that. Instead, the price kept on moving above the Alligator and it even broke the resistance level, which gave us a clear idea of the future movement – buy and take profit.
Forum on trading, automated trading systems and testing trading strategies
Something interesting, old thread
Sergey Golubev, 2017.07.06 13:59
Chart Clones - very good indicator which draw price charts as a subwindow.
By the way, this indicator needs to be improved so if someone is able to fix it - please upload here on the thread.
Volatility
2.1. Volatility Quality EA v301,
2.2. Volatility Quality EA v302 martingle EA,
2.3. Volatility Quality Expert Advisor v2 EA,
2.4. VQ_ Ea_v2 EA, VQ_ Ea_v2a EA (MaxTraders feature with LotMultiplier were fixed),
2.5. VQ_ Ea_v2 ecn-1a EA, VQ_ Ea_v3 ecn EA (It is the version with regular stop loss and take profit set by default to 5),
2.6. VQ_ Ea_v3 EA (It is improved version of VQ_ Ea_v3 ecn EA: added a trend confirmation, using 3 different time frames; also added a time frame control for VQ indicator; all these time frames can be adjusted by the use).
Volatility Quality - on chart - indicator for MetaTrader 5
Volatility Quality indicator made "on-chart" by bars, candles and lines.
Forum on trading, automated trading systems and testing trading strategies
Something Interesting
Sergey Golubev, 2016.04.29 07:38
This is very interesting (and very usefull) RSI indicator: RSI Monitor - indicator for MetaTrader 4
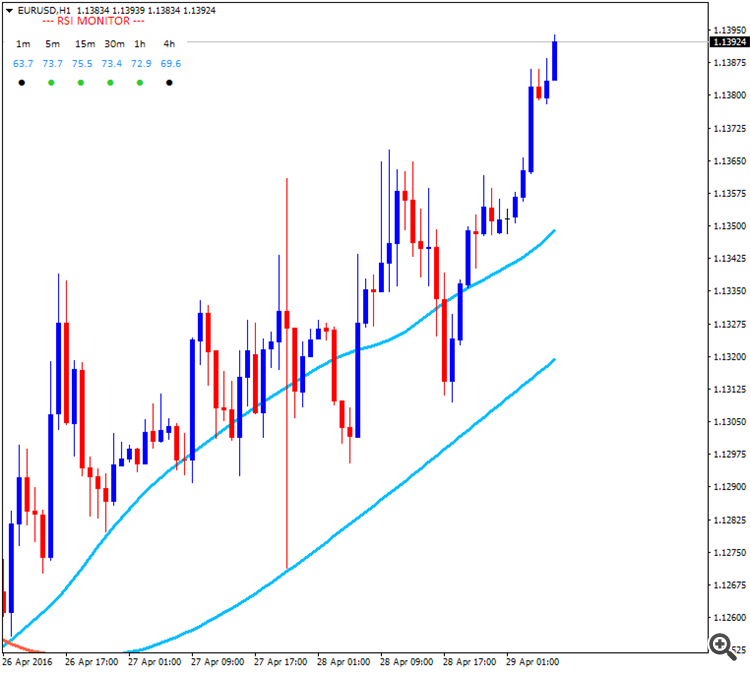
Description:If you trade with RSI indicator, here is another way to use it. This indicator will draw a small panel that shows all RSI values on all timeframes and will alert you when the price enters the Oversold, Overbought zones.
Features:RSS (Relative Spread Strength) - indicator for MetaTrader 5
Ian Copsey's indicator RSS (Relative Spread Strength) was presented in Stocks & Commodities in October, 2006.