Forecast and levels for Nikkei
Forum on trading, automated trading systems and testing trading strategies
Sergey Golubev, 2017.01.04 05:35
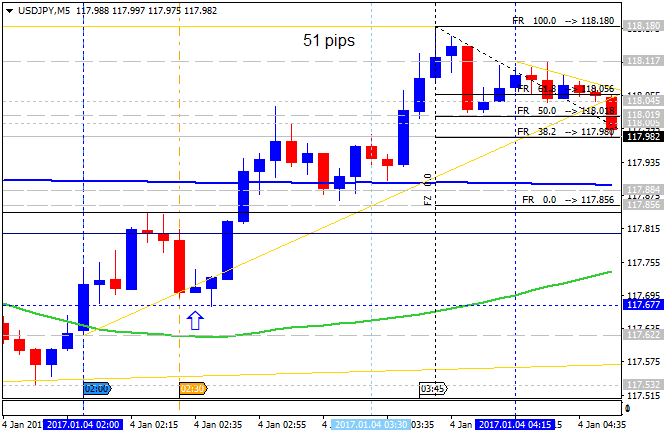
USD/JPY Intra-Day Fundamentals: Nikkei Japan Manufacturing PMI and 51 pips range price movement
2017-01-04 00:30 GMT | [JPY - Manufacturing PMI]
- past data is 51.9
- forecast data is 51.9
- actual data is 52.4 according to the latest press release
if actual > forecast (or previous one) = good for currency (for JPY in our case)
[JPY - Manufacturing PMI] = Level of a diffusion index based on surveyed purchasing managers in the manufacturing industry.
==========
From official report:
- "The headline Nikkei Japan Manufacturing Purchasing Managers’ IndexTM (PMI)TM is a composite single-figure indicator of manufacturing performance. It is derived from indicators for new orders, output, employment, suppliers’ delivery times and stocks of purchases. Any figure greater than 50.0 indicates overall improvement of sector operating conditions."
- "The headline PMI posted 52.4 in December, up from 51.3 in November, signalling a sharper improvement in manufacturing conditions in Japan. In fact, the latest reading was the highest since December last year and contributed to the strongest quarterly average since Q4 2015. The higher figure reflected increases in output, new orders and employment."
==========
USD/JPY M5: 51 pips price movement by Nikkei Japan Manufacturing PMI news event
==========
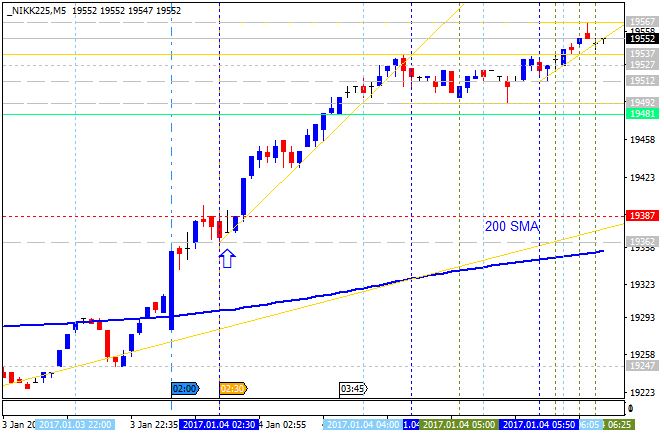
Nikkei 225 Index: pips range price movement by Nikkei Japan Manufacturing PMI news event
Forum on trading, automated trading systems and testing trading strategies
Sergey Golubev, 2017.01.24 08:34
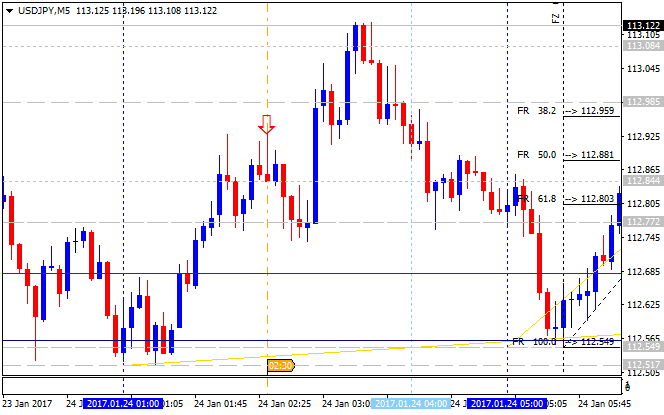
Intra-Day Fundamentals - USD/JPY and Nikkei 225 Index: Nikkei Manufacturing PMI
2017-01-24 00:30 GMT | [JPY - Flash Manufacturing PMI]
- past data is 52.4
- forecast data is 52.3
- actual data is 52.8 according to the latest press release
if actual > forecast (or previous one) = good for currency (for JPY in our case)
[JPY - Flash Manufacturing PMI] = Level of a diffusion index based on surveyed purchasing managers in the manufacturing industry.
==========
From official report:
- "Flash Japan Manufacturing PMI™ at 52.8 in January (52.4 in December), highest since March 2014."
- "Flash Manufacturing Output Index at 53.3 (53.8 in December). Production increases at solid pace."
==========
USD/JPY M5: range price movement by Nikkei Manufacturing PMI news events
==========
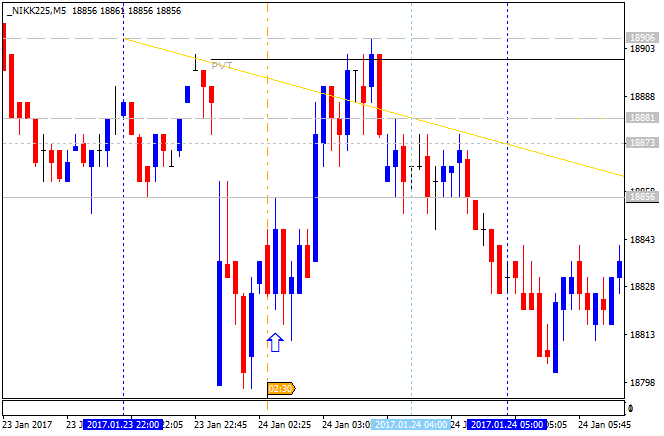
Nikkei 225 Index: range price movement by Nikkei Manufacturing PMI news events
Forum on trading, automated trading systems and testing trading strategies
Sergey Golubev, 2017.02.04 11:18
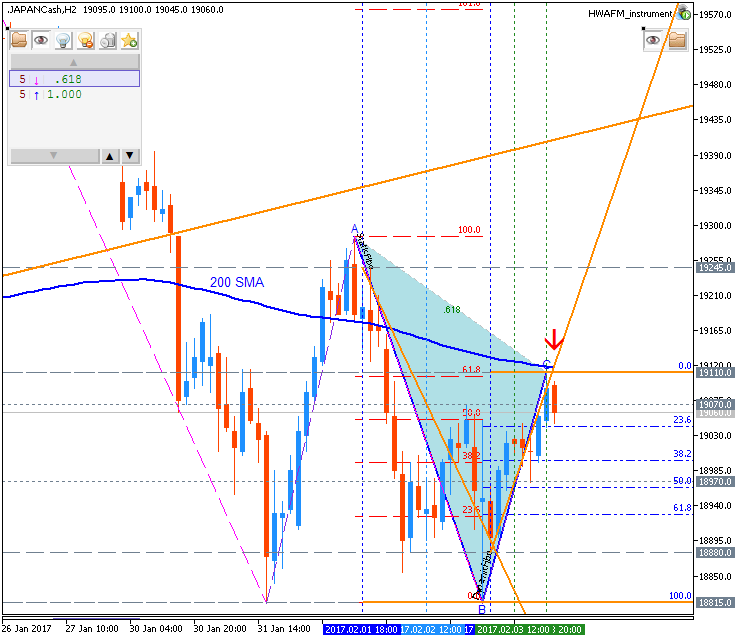
Weekly Outlook: 2017, February 05 - February 12 (based on the article)Rate decision in Australia and New Zealand, US Crude Oil Inventories, Unemployment Claims, Consumer Sentiment and Canadian employment data. These are the highlights of this week.
- Australian rate decision: Tuesday, 03:30.
- US Crude Oil Inventories: Wednesday, 15:30.
- New Zealand rate decision: Wednesday, 20:00.
- US Unemployment Claims: Thursday, 13:30. Economists expect new claims will reach 249,000 this week.
- Canadian employment data: Friday, 13:30.
- US Prelim UoM Consumer Sentiment: Friday, 15:00.
Forum on trading, automated trading systems and testing trading strategies
Sergey Golubev, 2017.02.18 18:22
Weekly Fundamental Forecast for Nikkei 225 (based on the article)
Forum on trading, automated trading systems and testing trading strategies
Sergey Golubev, 2017.03.11 19:08
Weekly Fundamental Forecast for Nikkei 225 (based on the article)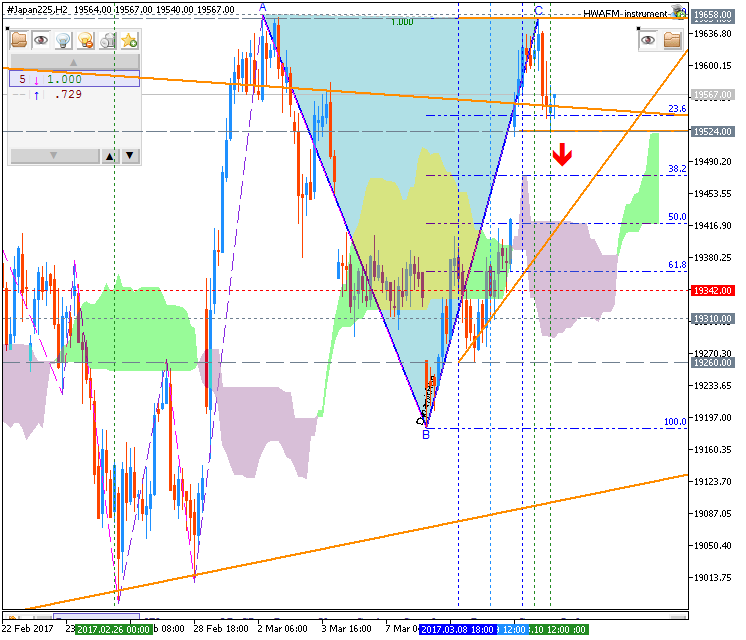
Nikkei 225 - "The big event out of Japan will come on Thursday, with the BoJ meeting. Expectations are for a fairly benign outcome, with the central bank not expected to make any changes to current policy. However, with that said, as per usual, expect the unexpected and manage risk accordingly."
Forum on trading, automated trading systems and testing trading strategies
Sergey Golubev, 2017.04.04 12:36
Nikkei 225: weekly correction, daily bearish reversal (based on the article)
Weekly price is located above Ichimoku cloud in the bullish area of the chart: the price is testing 18.795 support level to below on close weekly bar for the secondary correction to be started. By the way, the support level at 17,403 is the bearish reversal level, and if the price breaks this level to below so the reversal of the weekly price movementto the primary bearish market condition will be started.
Anyway, the daily price was already reversed to the bearish trend by good breakdown which was started in the beginning of the last month.
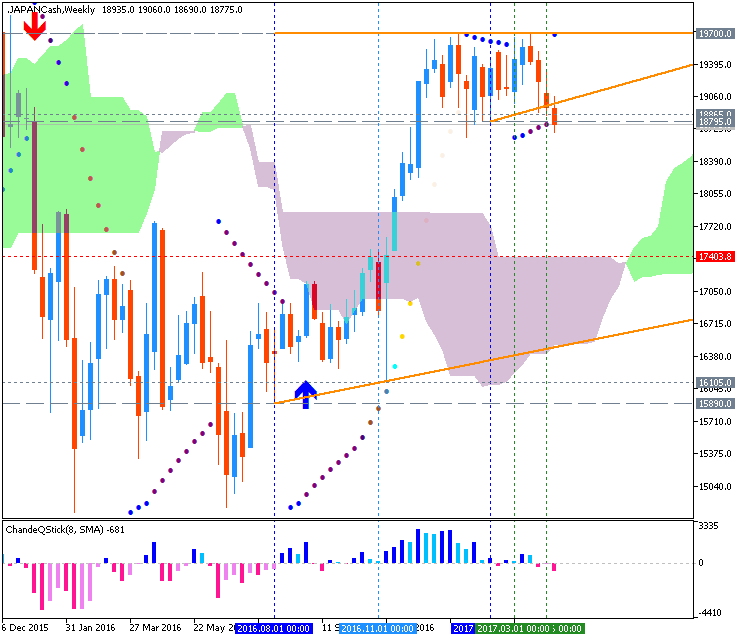
- "The Nikkei 225 seems to be in a spot of technical trouble, at least when looked at from a short-term perspective. This might not be obvious. After all, the index has been meandering for a couple of weeks, notching up almost as many rising days as fallers. Nevertheless, it has remained capped by a downward-sloping trend line in place since mid-March. That’s not good news for the bulls. Given current daily trading ranges a quick retake of that point looks like a big ask. This puts short-term focus on the downside, where clear support remans hard to sport until we get all the way back to 18823, which arrested the index’s early-February slide."
- "Longer-term however, the picture looks a little brighter. The Nikkei remains very well within an ascending channel which began back in July 2016. The base of that channel is miles away to the downside at around 17500."
Forum on trading, automated trading systems and testing trading strategies
Sergey Golubev, 2017.05.02 10:36
Nikkei 225 Index - daily bullish breakout (adapted from the article)
Daily price broke Ichimoku cloud to above for the breakout with the bullish reversal: Chinkou Span line crossed the historical price to above together with Tenkan-sen/Kijun/sen line bullish signal and 19,289 resistance level to be broken for the bullish trend to be continuing.
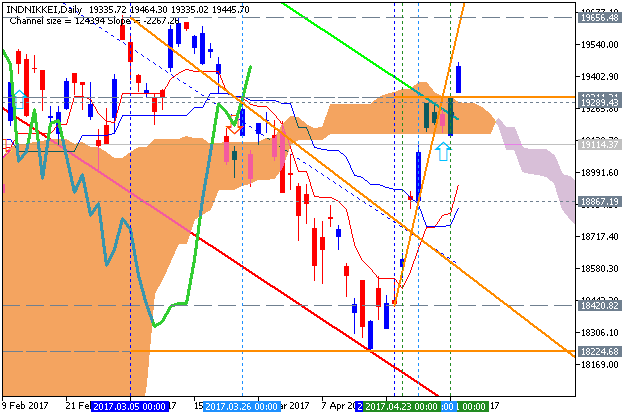
- "Back on April 11 the index succumbed to a fall which was small in magnitude but potentially bigger in implication because that move snapped to the downside a trading range which had endured for 2017. Indeed, it was put in place by the long climb up from the lows of June 2016."
- "Strong support was rather scant below that and the entire rise at least from November could have been threatened. That could potentially have taken the index all the way back down to 16898.
- "However, that fall seems to have been comprehensively rejected by the last few sessions’ action, which has in turn broken a downtrend channel which had been in place for nearly a month."
Forum on trading, automated trading systems and testing trading strategies
Sergey Golubev, 2017.05.16 14:14
Nikkei 225 Index - daily bullish; 20,015 is the key level (based on the article)
Daily shares price is located above Ichimoku cloud in the bullish area of the chart. The price is testing 20,015 resistance level to above for the bullish trend to be continuing.
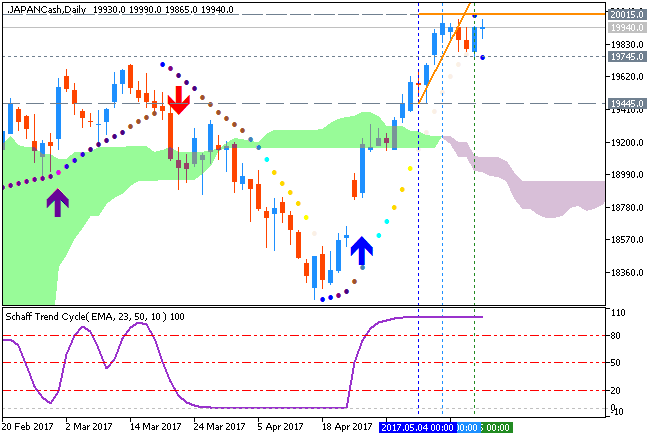
- "The Nikkei 225 has made its highs for the year in the past week. Indeed, it is now loitering around peaks not seen since the end of 2015."
- "Well, the technical signs are rather mixed as you’d expect. But they’re by no means universally gloomy. For one thing, the current thrust higher from April 17 has quite convincingly broken a notable down-channel in place since March 13. In the 21 trading sessions since that break the index has managed 13 daily gains and only seven (modest) losses on the way to current highs."
- "Moreover, the last time the index got up to these levels, it only stayed there for about twelve trading sessions before collapsing in exhaustion. This was back in 2015. This time it has already occupied the heights around 199800 for eight trading days. So, a weekly close around current levels and range trading into next week would be a pretty good sign for those worried that history will repeat itself."
Forum on trading, automated trading systems and testing trading strategies
Sergey Golubev, 2017.06.27 09:02
Nikkei 225 - daily bullish ranging; 20,315 is the key (based on the article)
Daily price is located above Ichimoku cloud in the bullish area of the chart. The price is on ranging within 19,155 bearish reversal support level and 20,315 bullish continuation resistance level. Tenkan-sen line of Ichimoku indicator is still above Kijun-sen line which is indicating the bullish trend to be continuing in the near future.
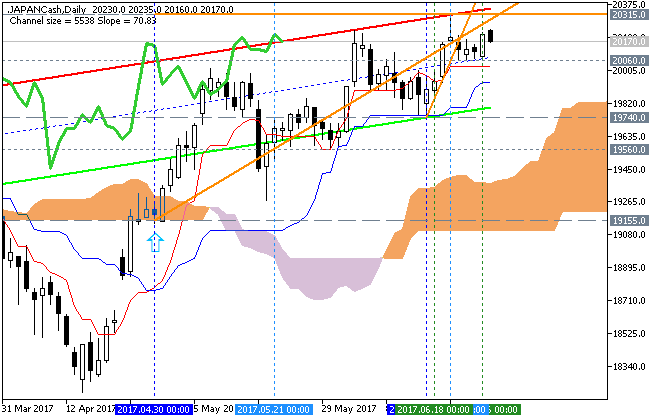
- "The Nikkei 225 looks quite comfortable around the big, 20,000 level. But how much higher does it want to go? Well, assuming that you’re a Nikkei bull, we’ll start with the good news. The index is still clearly within the uptrend channel which has marked its long and quite impressive rise from the lows of mid-May. That gain has taken the Tokyo equity benchmark to two-year highs and seen it top that psychologically important 20,000 mark which it remains above."
- "Indeed, the more recent bumpy, sideways slog across the channel’s lower reaches makes it more likely that the index has in fact been consolidating for the past month or so. For sure it has done so in a higher range than that which came before, but it remains to be seen whether that consolidation marks a top or a base for a push yet higher."
Forum on trading, automated trading systems and testing trading strategies
Sergey Golubev, 2017.07.15 07:17
3 Big Mistakes And How To Correct Them (based on the article)
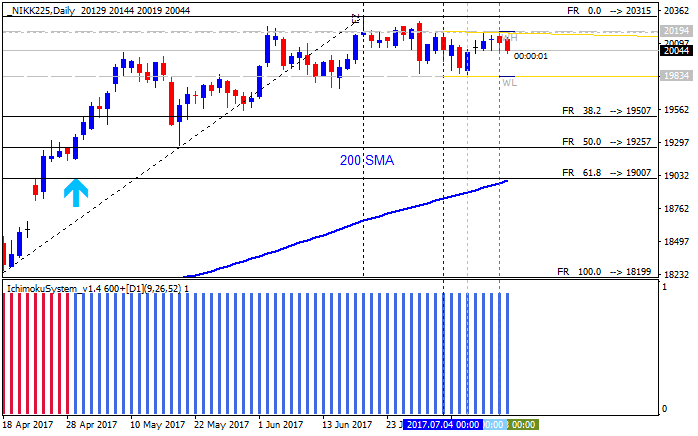
- Looking for a breakout in all the wrong the places
- Trading last year’s headlines today is comforting but ineffective
- Do not ‘set it and forgetit,' stay nimble and keep checking the market’s vital signs to manage trades
Daily price is located above 200 SMA in he bullish area of the chart: the price is ranging within 19,834 support and 20,315 resistance levels for the correction to be started or for the bullish trend to be continuing.
- Free trading apps
- Over 8,000 signals for copying
- Economic news for exploring financial markets
You agree to website policy and terms of use
Forum on trading, automated trading systems and testing trading strategies
Press review
Sergey Golubev, 2016.12.24 17:18
Nikkei Q1 2017 Fundamental Forecast: Bullish (based on the article)
Fundamental Analysis