The Worst Stocks Of 2016, 2017, 2018, 2019, and more
I did not find Metatrader charts/quotes for the following worst stocks of 2016
- TripAdvisor
- Perrigo
- Vertex Pharma
- Allergan
- Under Armour
- Alexion
- Stericycle
- Illumina
Forum on trading, automated trading systems and testing trading strategies
Sergey Golubev, 2017.02.21 16:19
HSBC: breakdown to bearish reversal Senkou Span level (based on the article)
Daily share price broke support levels to below: the price is testing 41.50/41.15 levels which are located near Senkou Span line to be reversed to the primary bearish market condition.
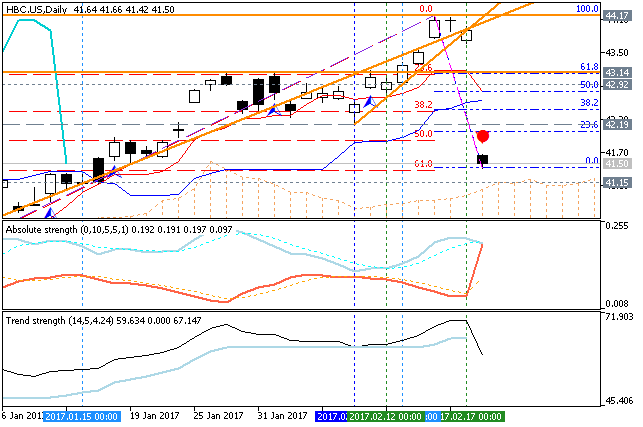
- "Banking colossus HSBC was the FTSE 100’s leading faller in Tuesday business following the release of disappointing full-year financials. The stock was last dealing 7% lower from Monday’s close."
- "Despite the shocking bottom-line fall, however, HSBC chief executive Stuart Gulliver described the results as ‘broadly satisfactory,’ the firm’s head citing the huge geopolitical and economic events last year which ‘temporarily influenced investment activity and contributed to volatile financial market conditions.’"
Forum on trading, automated trading systems and testing trading strategies
Sergey Golubev, 2017.04.17 08:13
IBM - daily bearish with descending triangle; 168.98 support is the key (based on the article)
Share price was on the correction since the beginning of March this year: the price broke support levels to below to be located inside Ichimoku cloud for the ranging condition waiting for direction. The downtrend was continuing in the beginning of April by breaking Ichimoku cloud to below to be reversed to the primary bearish market condition.
If the price breaks descending triangle pattern together with 168.98 support level to below so the bearish trend will be resumed, if not so the price will be on bearish ranging waiting for direction.
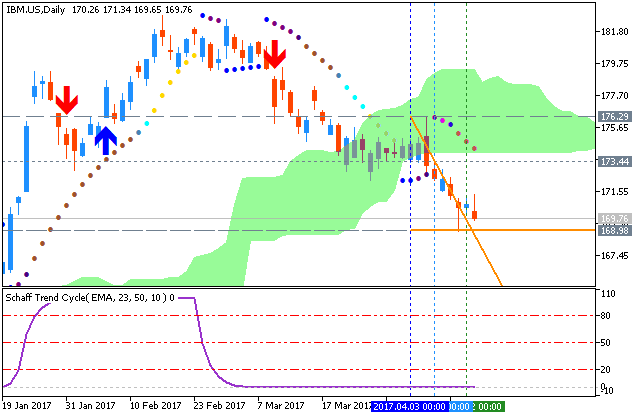
- "IBM is scheduled to report earnings after Tuesday's close. IBM's stock hit a record high of $215.90/share in 2013 and is trading near $169/share. The stock is prone to big moves after reporting earnings and can easily gap up if the numbers are strong. Conversely, if the numbers disappoint, the stock can easily gap down."
- "IBM is expected to earn $2.34/share on $18.49 billion in revenue. Meanwhile, the so-called Whisper number is $2.38. The Whisper number is the Street's unofficial view on earnings."
Forum on trading, automated trading systems and testing trading strategies
Sergey Golubev, 2017.06.01 11:24
Nike - shares estimate to 51 (based on the article)
Nike shares price is located near and below Ichimoku cloud in the bearish area of the chart. The descent bearish triangle pattern was formed by the price together with 50.81 to be crossed to below for the weekly primary bearish trend to be continue.

- "Despite its consistent growth in recent years, Nike is facing some headwinds in several of its businesses. Apart from a soft U.S. apparel market, the company has also been facing increased competition from the likes of Under Armour and Adidas in the footwear market. Furthermore, the sportswear manufacturer is facing pressure on demand for its products, as indicated by lower-than-expected future orders."
- "Taking the aforementioned factors into account, we have reduced our price estimate for Nike by around 14% to $51, which is slightly below the current market price. The company is still well-positioned for future growth, but meeting its ambitious targets may be difficult."
Forum on trading, automated trading systems and testing trading strategies
Sergey Golubev, 2017.07.08 09:37
General Electric‘s (NYSE: GE) - daily bearish breakdown; 26 level is the key (based on the article)
Daily price is on berish breakdown to be located below Ichimoku cloud in the bearish area of the chart. The price is breaking 26.10 support level to below for the bearish trend to be continuing.
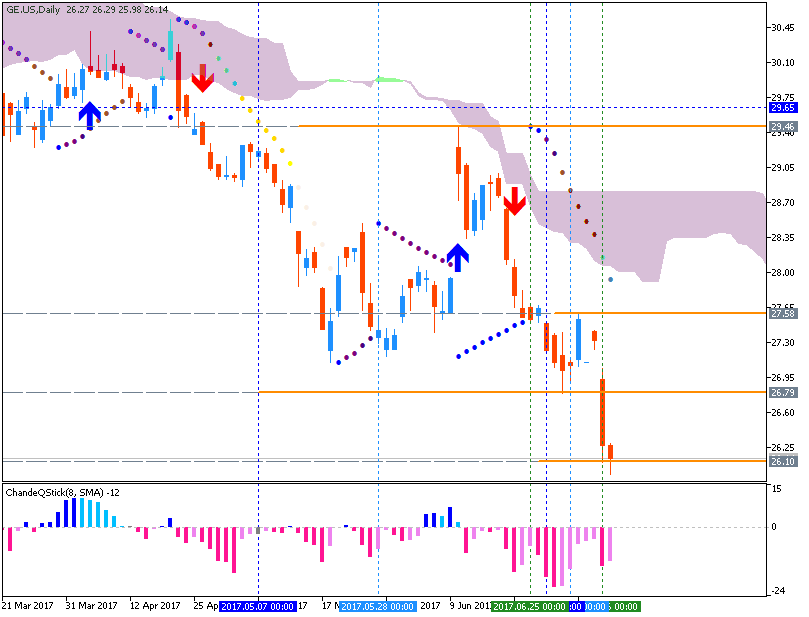
- "General Electric's stock has declined nearly 10% since the start of the year, significantly underperforming compared to the broader market. Goldman Sachs also downgraded GE recently, stating that the company may be forced to cut dividends this year. There are a few major factors that have contributed to GE’s underperformance this year. First, GE has reduced its dividends in the last 12 months, which may have impacted investor confidence. Secondly, GE’s industrial free cash flow was negative – and worse than expected – in Q1, though much of that was due to fluctuations in GE Aviation receivables, which will likely be offset in the next few quarters. Third, lower crude oil prices continue to put pressure on GE’s margins. Below we discuss these factors further."
- "GE has underperformed the market over the past several years, but in recent months the company has been facing heat from investors over dividends and lower profits. The reduction in dividends is a result of pressure on GE’s profits due to continued weakness in the oil & gas industry, among other factors. However, its dividend yield in the last few years has been consistent with its pre-recession levels, as GE repurchased about $22 billion worth of stock in 2016."
Forum on trading, automated trading systems and testing trading strategies
Sergey Golubev, 2017.08.31 18:24
Ferrari N.V. (NYSE:RACE) - this company is good name, but ready for a cool down (based on the article)
The price was on the bullish breakout since the beginning of the July this year. The price is on ranging within 116 resistance and 106 support levels being in totally overbought condition to be ready for the secondary correction with possible bullish reversal in the near future for example.
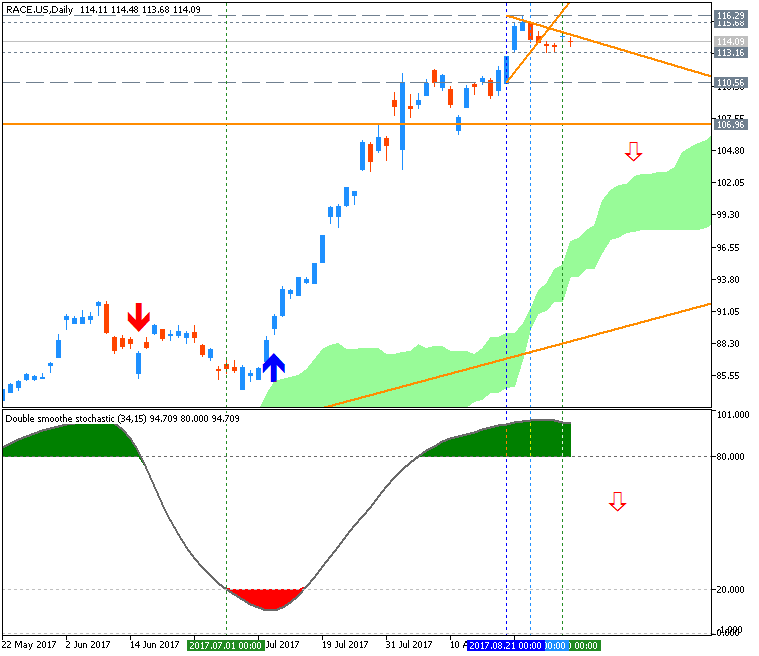
- "RACE stocks have been a public company for less than two years. In that time its stock’s increased in value by 71.4% from its IPO price of $52 through June 21. Most of the gains coming in 2017, up 53.8% year-to-date".
- "So, now that it’s had a strong run in 2017, and trades at 31 times its forward price-earnings ratio, I see its stock getting stuck in neutral. Wealthy people might buy Ferrari’s cars, but I doubt they’re going to want to own it at $100 per share".
Forum on trading, automated trading systems and testing trading strategies
Sergey Golubev, 2018.02.10 15:22
February 2018 Market Crisis (based on the article)

- "The recent downside moves in the US majors did freak a lot of people out. It was something that startled people and pushed a panic button for many. Certainly, the rotation in the VIX and volatility related ETN’s pushed many people over the edge. In fact, recent news is that these volatility related ETN’s exasperated the selloff as the VIX shorts were pushed out of positions and into a protectionist mode with the massive spike in volatility. As the old floor trader saying goes “want to know what causes the markets to crash? Buyers that turn into sellers to protect from unwanted losses”. In fact, the fear and selling were so strong it sent the safe havens tumbling lower, which we took advantage of trading the DUST gold miners ETF for a quick 20% profit."
- "First, we have strong economic and fundamental US and global data that is showing increases in the global economy, GDP, output, employment and more. We are still seeing price appreciation and strong activity in most locations which indicates the top has not formed yet. Therefore, we believe this February market crisis is, as of right now, a unique instance of a “shakeout” after a lengthy period of very low volatility. Almost like the market needed to “breathe” and in order to do that, it needed to roll out of a low volatility range. Now that this is taking place now. We believe the markets are setting up for a very quick FLAG/Pennant formation that will prompt a burst higher towards a March 15th peak."
- "Certainly, there is the risk of further downside price activity. Certainly, some news item could come out in the future that could drive the markets substantially lower. We believe the US and Global markets are strong fundamentally and that the new growth in the economic output will continue to try and push equities higher as expectations of increased global economic activity continues. Immediately, we are targeting the March 15th price peak."
============
The chart was made on weekly timeframe with Ichimoku market condition setup (MT5) from this post (free to download for indicators and template) as well as the following indicators from CodeBase:
- MaksiGen_Range_Move MTF - indicator for MetaTrader 5
- Price prediction by Nearest Neighbor found by a weighted correlation coefficient - indicator for MetaTrader 5
- Fibo Bar MT5 - indicator for MetaTrader 5
Forum on trading, automated trading systems and testing trading strategies
Sergey Golubev, 2019.01.19 06:09
How Stock Markets Affect the Forex Market (based on the article)
- "Many Forex traders focus too narrowly on the currency pair or pairs they are trading. While it is important to be focused on a short-term chart if you are trading something on a short-term time horizon, it can help your profitability a lot if you look at the market in a broader way, as part of your process of deciding which currency pair to trade, and in which direction. Although it is possible to do OK by only looking at the Forex market, you could do better by considering what is going on in stock and commodity markets too when you analyze the Forex market. One reason why would be if there were a statistical correlation between the movement of the stock market and certain currencies or commodities. Furthermore, if such correlations can be found, it might be that they become even stronger or weaker under particular market conditions. This should be useful information for Forex traders as it can be used to move the odds in their favor."
- "Correlation is simply the measurement of how much the prices of two different things have moved in the same direction over the same time. For example, if the prices of A and B always go up or down by the same percentage every day, completely in sync, then A and B would have a correlation coefficient of 1 (perfect positive correlation). If they always move in precisely the opposite directions by the same amount, they would have a correlation coefficient of -1 (perfect negative correlation). If there is no statistical relationship between the price movements of A and B at all, they will have a correlation coefficient of 0 (perfectly uncorrelated). I won't detail the full formula of how the correlation coefficient between two variables is calculated here: it is enough to note that when such a statistical relationship can be proven over a long time period, we may be able to say that this relationship is likely to continue for some time in the future. However, it is important to understand that there are times when market correlations seem to break down entirely, so it is probably best to use correlation as a filtering tool for trades and not as the basis of an entire trading strategy."
- "We can best illustrate the concept of using correlation between a stock market and currencies by taking the major U.S. stock market index, the S&P 500, which measures the valuation of the 500 largest publicly quoted U.S. companies by market capitalization and checking its statistical correlation with some Forex currency pairs which are priced in USD. That way, we can easily see the simple correlation between the non-USD currency and the stock market as measured by this index. As an additional step, we can also see whether the correlations were different during bear market periods, which are defined as the periods during which the market falls by at least 20% in value. Bull markets are defined as the periods during which the market rises by at least 20% in value."
==========
Chart was made on MT5 with Brainwashing system/AscTrend system (MT5) from this thread (free to download) together with following indicators:
- Ichimoku Cloud - indicator for MetaTrader 5
- MFCS Currency Correlation Chart - indicator for MetaTrader 5
Forum on trading, automated trading systems and testing trading strategies
Sergey Golubev, 2019.01.29 08:32
Nvidia’s stock: daily bearish breakdown (based on the article)

- "Nvidia’s stock was hammered today after it warned on Q4 earnings. The slump has been particularly bad — at this writing, it’s fallen 13.68 percent — because Nvidia’s Q4 2018 already wasn’t going to be as good as analysts were hoping back in Q3. When Nvidia made its Q3 2018 earnings announcement, it declared that the collapse in GPU demand for crypto mining had left it with a glut of Pascal GPUs to sell. As a result, it would not manufacture additional midrange cards in Q4 and would instead focus on moving its existing inventory. This led to Q4 earnings would be lower than what investors might expect."
============
The chart was made on daily timeframe with Ichimoku market condition setup (MT5) from this post (free to download for indicators and template) as well as the following indicators from CodeBase:
- MaksiGen_Range_Move MTF - indicator for MetaTrader 5
Forum on trading, automated trading systems and testing trading strategies
Sergey Golubev, 2019.10.13 08:38
Most Oversold Dow Stocks (based on the article)
With Friday’s strong close, there is the potential for the stock market to rally further, if a trade deal is signed. Do any of the most oversold stocks in the Dow Jones Industrial Average look attractive for new purchase?
 chart by Metatrader 5")
- "The Coca-Cola Company (KO) was down 2.3% last week, but closed above the prior week’s low of $52.82. Its 20-week Exponential Moving Average (EMA) is at $52.47 with chart support (line a) at $51.95. The weekly starc- band is at $50.94 which is 4.46% below Friday’s close."
 chart by Metatrader 5")
- "Two weeks ago, the Travelers Company (TRV) dropped below support going back to May at $142.27 (point 1). The 38.2% support from the late 2018 low of $109. 23 is at $137.04. The weekly starc- band is at $135.68, which is 5% below Friday’s close. There is initial resistance now at $145.50, and the 20-week EMA with stronger resistance at $149.58. The RS turned negative in early September and dropped below support (line b) in early September, which was another sign of weakness. The OBV had turned negative at the start of August when it dropped below its declining WMA. The OBV declined further last week."
 chart by Metatrader 5")
- "Proctor & Gamble Company (PG) was down 2.3% last week, while the S&P 500 was up 0.62%. PG had a low of $120.21 on October 2,
with the rising 20-week EMA at $116.56. The weekly uptrend from the October 2018 low is at $114.72 (line a), which is quite close
to the weekly starc- band at $114.68. PG made an all-time high of $125.36 on September 30 which is now key resistance."
==========
The chart was made on MT5 with standard indicators of Metatrader 5 together with the following indicator from CodeBase:
- MaksiGen_Range_Move MTF - indicator for MetaTrader 5
- Price prediction by Nearest Neighbor found by a weighted correlation coefficient - indicator for MetaTrader 5
- Free trading apps
- Over 8,000 signals for copying
- Economic news for exploring financial markets
You agree to website policy and terms of use
The Worst Stocks Of 2016: First Solar
It was decreased from 72 to 28 for this 2016!