Join our fan page
- Views:
- 47294
- Rating:
- Published:
- Updated:
-
 You are missing trading opportunities:
- Free trading apps
- Over 8,000 signals for copying
- Economic news for exploring financial markets
Registration Log inYou agree to website policy and terms of use
If you do not have an account, please register -
 Need a robot or indicator based on this code? Order it on Freelance
Go to Freelance
Need a robot or indicator based on this code? Order it on Freelance
Go to Freelance
Description:
This indicator is EMAs drawn by Fibonacci numbers.
There are part1 and part2:
Part1-->EMA 34(High,Close,Low), 55, 89, 144, 200
Part2--->EMA 233, 377, 610, 987, 1598
Images:
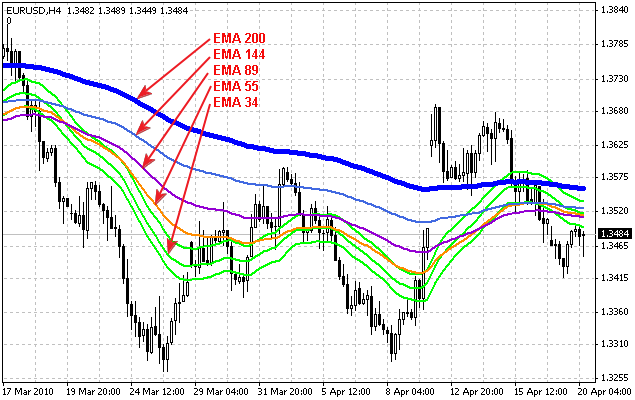
Figure 1. Fibonacci-based Moving Averages- Part 1
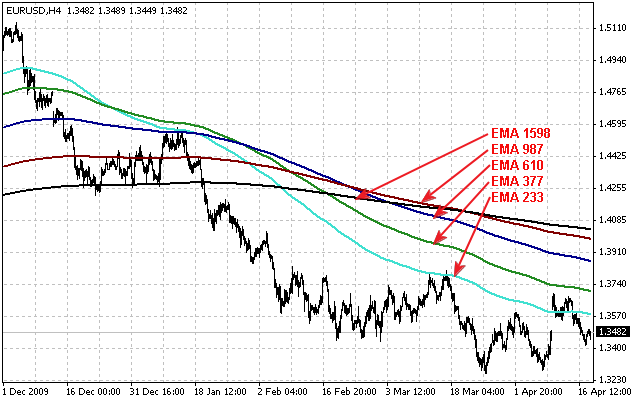
Figure 2. Fibonacci-based Moving
Averages- Part 2
 Simple Adviser EMA WMA RSI
Simple Expert Advisor. In this version RSI and Trailing Stop has been added.
 Three Indians
Detection of a pattern "three Indians" on the basis of the ZigZag.
HighLowLines
Shows you the value of the highest high, the lowest low and the average of both over the last x Bars (to be set in the input tab).
Support and resistance levels
This a bollinger band indicator with an extra deviation level. If you keep the period at 25 and deviations of 1.0 and 2.0, It will show you all your resistance and support lines. And also overbought and oversold levels.