Join our fan page
- Views:
- 16932
- Rating:
- Published:
- Updated:
-
 You are missing trading opportunities:
- Free trading apps
- Over 8,000 signals for copying
- Economic news for exploring financial markets
Registration Log inYou agree to website policy and terms of use
If you do not have an account, please register -
 Need a robot or indicator based on this code? Order it on Freelance
Go to Freelance
Need a robot or indicator based on this code? Order it on Freelance
Go to Freelance
An expert advisor designed to open and close respective orders at the
first parabolic SAR signal. Its performance depends on the custom
parameters of stop loss, take profit, trailing stop, lot size for
opening trades and more. Note: You need to change the
SAR indicator "Step" and "maximum" value/s to that of the EA in order to match the EA operation with that of the SAR indicator. But this is just
for visual purposes as the EA does'nt need the indicator in order to
work. e.g. if you are using the default step setting for the EA (0.001) you might get a false impression that the EA didnt open an order when the SAR indicator with its default step setting (0.02) showed a signal but in reality the virtual SAR with a step setting of 0.001 had'nt yet shown a signal. If no order was opened and the journal displayed an error as to why, thats when action needs to be taken. Always check this page for updates thank you !!!. Please donate to my projects in order to keep this EA and others together with their future versions 100% free. My moneybookers email is admin@forexyangu.com. Anyone can join moneybookers and send money via numerous methods.

___________________________________________________________________________________________________
Sample
1 below was done using EURJPY H4, StopLoss 180, TakeProfit 870, Step 0.001, lots 20,
initial deposit of $35000.
From 1st january 2010 to 18 february 2010(the day i uploaded this EA).
___________________________________________________________________________________________________
| Symbol | EURJPYFXF (Euro vs Japanese Yen) | ||||
| Period | 4 Hours (H4) 2010.01.03 22:00 - 2010.02.17 20:00 (2010.01.01 - 2010.02.18) | ||||
| Model | Every tick (the most precise method based on all available least timeframes) | ||||
| Parameters | DonateTo="Moneybookers: admin@forexyangu.com"; StopLoss=180; TakeProfit=870; Lots=20; Slippage=5; Caution="Advanced settings follow. Dont change if you dont know what you are doing."; Step=0.001; Maximum=0.2; ContactMe="admin@forexyangu.com"; | ||||
| Bars in test | 1207 | Ticks modelled | 774721 | Modelling quality | 90.00% |
| Mismatched charts errors | 5 | ||||
| Initial deposit | 35000.00 | ||||
| Total net profit | 183382.98 | Gross profit | 187499.73 | Gross loss | -4116.75 |
| Profit factor | 45.55 | Expected payoff | 91691.49 | ||
| Absolute drawdown | 8057.49 | Maximal drawdown | 53244.82 (37.54%) | Relative drawdown | 40.67% (24063.63) |
| Total trades | 2 | Short positions (won %) | 1 (100.00%) | Long positions (won %) | 1 (0.00%) |
| Profit trades (% of total) | 1 (50.00%) | Loss trades (% of total) | 1 (50.00%) | ||
| Largest | profit trade | 187499.73 | loss trade | -4116.75 | |
| Average | profit trade | 187499.73 | loss trade | -4116.75 | |
| Maximum | consecutive wins (profit in money) | 1 (187499.73) | consecutive losses (loss in money) | 1 (-4116.75) | |
| Maximal | consecutive profit (count of wins) | 187499.73 (1) | consecutive loss (count of losses) | -4116.75 (1) | |
| Average | consecutive wins | 1 | consecutive losses | 1 | |
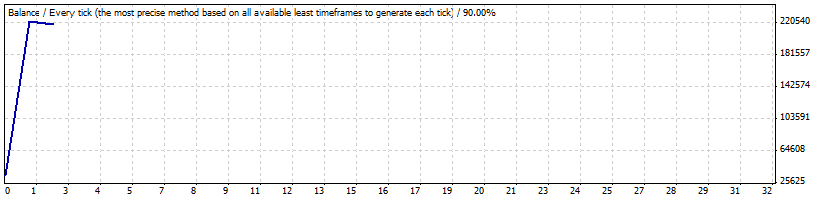
| # | Time | Type | Order | Size | Price | S / L | T / P | Profit | Balance |
| 1 | 2010.01.20 01:19 | sell | 1 | 20.00 | 129.54 | 131.34 | 120.84 | ||
| 2 | 2010.02.05 18:30 | t/p | 1 | 20.00 | 120.84 | 131.34 | 120.84 | 187499.73 | 222499.73 |
| 3 | 2010.02.16 16:36 | buy | 2 | 20.00 | 124.13 | 122.33 | 132.83 | ||
| 4 | 2010.02.17 23:59 | close at stop | 2 | 20.00 | 123.94 | 122.33 | 132.83 | -4116.75 | 218382.98 |
___________________________________________________________________________________________________
Sample 2 below was done using EURJPY M30, StopLoss 90, TakeProfit 20, Step 0.001, lots 20, initial deposit of $30000.
From 1st january 2010 to 19 february 2010.
___________________________________________________________________________________________________
| Symbol | EURJPYFXF (Euro vs Japanese Yen) | ||||
| Period | 30 Minutes (M30) 2010.01.03 22:00 - 2010.02.19 21:30 (2010.01.01 - 2010.02.20) | ||||
| Model | Every tick (the most precise method based on all available least timeframes) | ||||
| Parameters | DonateTo="Moneybookers: admin@forexyangu.com"; StopLoss=90; TakeProfit=20; Lots=20; Slippage=5; Caution="Advanced settings follow. Dont change if you dont know what you are doing."; Step=0.001; Maximum=0.2; ContactMe="admin@forexyangu.com"; | ||||
| Bars in test | 2681 | Ticks modelled | 828538 | Modelling quality | 90.00% |
| Mismatched charts errors | 13 | ||||
| Initial deposit | 35000.00 | ||||
| Total net profit | 96048.34 | Gross profit | 96048.34 | Gross loss | -0.00 |
| Profit factor | Expected payoff | 4365.83 | |||
| Absolute drawdown | 2622.09 | Maximal drawdown | 21202.19 (33.15%) | Relative drawdown | 33.15% (21202.19) |
| Total trades | 22 | Short positions (won %) | 12 (100.00%) | Long positions (won %) | 10 (100.00%) |
| Profit trades (% of total) | 22 (100.00%) | Loss trades (% of total) | 0 (0.00%) | ||
| Largest | profit trade | 4437.16 | loss trade | -0.00 | |
| Average | profit trade | 4365.83 | loss trade | -0.00 | |
| Maximum | consecutive wins (profit in money) | 22 (96048.34) | consecutive losses (loss in money) | 0 (-0.00) | |
| Maximal | consecutive profit (count of wins) | 96048.34 (22) | consecutive loss (count of losses) | -0.00 (0) | |
| Average | consecutive wins | 22 | consecutive losses | 0 | |
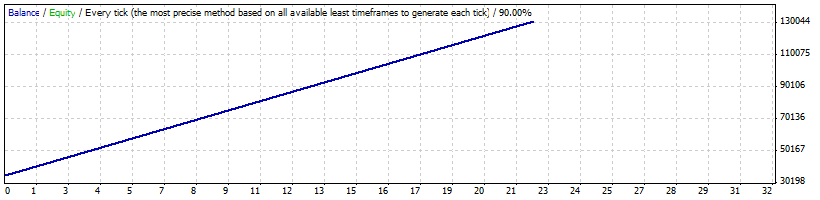
| # | Time | Type | Order | Size | Price | S / L | T / P | Profit | Balance |
| 1 | 2010.01.03 23:17 | sell | 1 | 20.00 | 132.93 | 133.83 | 132.73 | ||
| 2 | 2010.01.04 00:07 | t/p | 1 | 20.00 | 132.73 | 133.83 | 132.73 | 4260.86 | 39260.86 |
| 3 | 2010.01.04 09:57 | buy | 2 | 20.00 | 133.52 | 132.62 | 133.72 | ||
| 4 | 2010.01.04 11:07 | t/p | 2 | 20.00 | 133.72 | 132.62 | 133.72 | 4371.58 | 43632.44 |
| 5 | 2010.01.05 04:32 | sell | 3 | 20.00 | 132.63 | 133.53 | 132.43 | ||
| 6 | 2010.01.05 04:48 | t/p | 3 | 20.00 | 132.43 | 133.53 | 132.43 | 4370.15 | 48002.59 |
| 7 | 2010.01.05 04:48 | sell | 4 | 20.00 | 132.40 | 133.30 | 132.20 | ||
| 8 | 2010.01.05 05:00 | t/p | 4 | 20.00 | 132.20 | 133.30 | 132.20 | 4370.15 | 52372.74 |
| 9 | 2010.01.06 15:18 | buy | 5 | 20.00 | 133.10 | 132.20 | 133.30 | ||
| 10 | 2010.01.06 15:59 | t/p | 5 | 20.00 | 133.30 | 132.20 | 133.30 | 4371.58 | 56744.32 |
| 11 | 2010.01.12 01:16 | sell | 6 | 20.00 | 133.19 | 134.09 | 132.99 | ||
| 12 | 2010.01.12 09:21 | t/p | 6 | 20.00 | 132.99 | 134.09 | 132.99 | 4370.15 | 61114.47 |
| 13 | 2010.01.13 13:07 | buy | 7 | 20.00 | 133.07 | 132.17 | 133.27 | ||
| 14 | 2010.01.14 02:56 | t/p | 7 | 20.00 | 133.27 | 132.17 | 133.27 | 4437.16 | 65551.63 |
| 15 | 2010.01.14 15:52 | sell | 8 | 20.00 | 131.95 | 132.85 | 131.75 | ||
| 16 | 2010.01.14 16:11 | t/p | 8 | 20.00 | 131.75 | 132.85 | 131.75 | 4370.15 | 69921.78 |
| 17 | 2010.01.21 01:36 | buy | 9 | 20.00 | 129.16 | 128.26 | 129.36 | ||
| 18 | 2010.01.21 14:32 | t/p | 9 | 20.00 | 129.36 | 128.26 | 129.36 | 4371.58 | 74293.36 |
| 19 | 2010.01.21 15:28 | sell | 10 | 20.00 | 128.45 | 129.35 | 128.25 | ||
| 20 | 2010.01.21 15:49 | t/p | 10 | 20.00 | 128.25 | 129.35 | 128.25 | 4370.15 | 78663.51 |
| 21 | 2010.01.26 00:18 | buy | 11 | 20.00 | 128.11 | 127.21 | 128.31 | ||
| 22 | 2010.01.26 01:18 | t/p | 11 | 20.00 | 128.31 | 127.21 | 128.31 | 4371.58 | 83035.09 |
| 23 | 2010.01.26 05:09 | sell | 12 | 20.00 | 126.58 | 127.48 | 126.38 | ||
| 24 | 2010.01.26 05:18 | t/p | 12 | 20.00 | 126.38 | 127.48 | 126.38 | 4370.15 | 87405.24 |
| 25 | 2010.01.26 05:18 | sell | 13 | 20.00 | 126.35 | 127.25 | 126.15 | ||
| 26 | 2010.01.26 06:36 | t/p | 13 | 20.00 | 126.15 | 127.25 | 126.15 | 4370.15 | 91775.39 |
| 27 | 2010.01.28 07:14 | buy | 14 | 20.00 | 126.68 | 125.78 | 126.88 | ||
| 28 | 2010.01.28 07:43 | t/p | 14 | 20.00 | 126.88 | 125.78 | 126.88 | 4371.58 | 96146.97 |
| 29 | 2010.01.28 16:18 | sell | 15 | 20.00 | 125.31 | 126.21 | 125.11 | ||
| 30 | 2010.01.29 00:18 | t/p | 15 | 20.00 | 125.11 | 126.21 | 125.11 | 4260.85 | 100407.82 |
| 31 | 2010.02.01 15:20 | buy | 16 | 20.00 | 126.36 | 125.46 | 126.56 | ||
| 32 | 2010.02.02 00:47 | t/p | 16 | 20.00 | 126.56 | 125.46 | 126.56 | 4393.45 | 104801.27 |
| 33 | 2010.02.04 08:50 | sell | 17 | 20.00 | 125.78 | 126.68 | 125.58 | ||
| 34 | 2010.02.04 09:28 | t/p | 17 | 20.00 | 125.58 | 126.68 | 125.58 | 4370.16 | 109171.43 |
| 35 | 2010.02.09 02:07 | buy | 18 | 20.00 | 122.28 | 121.38 | 122.48 | ||
| 36 | 2010.02.09 05:13 | t/p | 18 | 20.00 | 122.48 | 121.38 | 122.48 | 4371.58 | 113543.01 |
| 37 | 2010.02.11 11:15 | sell | 19 | 20.00 | 123.18 | 124.08 | 122.98 | ||
| 38 | 2010.02.11 12:18 | t/p | 19 | 20.00 | 122.98 | 124.08 | 122.98 | 4370.15 | 117913.16 |
| 39 | 2010.02.15 22:57 | buy | 20 | 20.00 | 122.53 | 121.63 | 122.73 | ||
| 40 | 2010.02.16 04:38 | t/p | 20 | 20.00 | 122.73 | 121.63 | 122.73 | 4393.44 | 122306.60 |
| 41 | 2010.02.18 01:43 | sell | 21 | 20.00 | 123.57 | 124.47 | 123.37 | ||
| 42 | 2010.02.18 02:56 | t/p | 21 | 20.00 | 123.37 | 124.47 | 123.37 | 4370.15 | 126676.75 |
| 43 | 2010.02.19 12:35 | buy | 22 | 20.00 | 124.15 | 123.25 | 124.35 | ||
| 44 | 2010.02.19 15:46 | t/p | 22 | 20.00 | 124.35 | 123.25 | 124.35 | 4371.59 | 131048.34 |
 Multi Strategy Ea
If you have a strategy to trade with it, You can use this EA and set Your Parameters And trade with this expert
 RenkoShade2 - Draws Renko boxes in normal TF
This indi draws renko boxes on normal TF window.
pSAR Alert2
Now with added options and features. pSAR Alert plays a sound whenever a first parabolic SAR signal appears.
Analysis of the waves
The Indicator analyses last 100 waves and shows its sizes, average volumes and average velocities (in pips/hour) for each wave.