 MetaTrader 5
 Experts
 Indicators
 Scripts
 Libraries
 Storage
Watch how to download trading robots for free
Find us on Telegram!
Join our fan page
Join our fan page
You liked the script? Try it in the MetaTrader 5 terminal

Spread By Hour - average and max spread per hour, live spread vs usual - indicator for MetaTrader 5
Saad Ferdi

MQL5 and Python developer focused on gold and forex.
I build and fix MT5 Expert Advisors and indicators, with clean source code and clear input settings.
I build and fix MT5 Expert Advisors and indicators, with clean source code and clear input settings.
- Views:
- 62
- Rating:
- Published:
-
 You are missing trading opportunities:
- Free trading apps
- Over 8,000 signals for copying
- Economic news for exploring financial markets
Registration Log inYou agree to website policy and terms of use
If you do not have an account, please register -
 Need a robot or indicator based on this code? Order it on Freelance
Go to Freelance
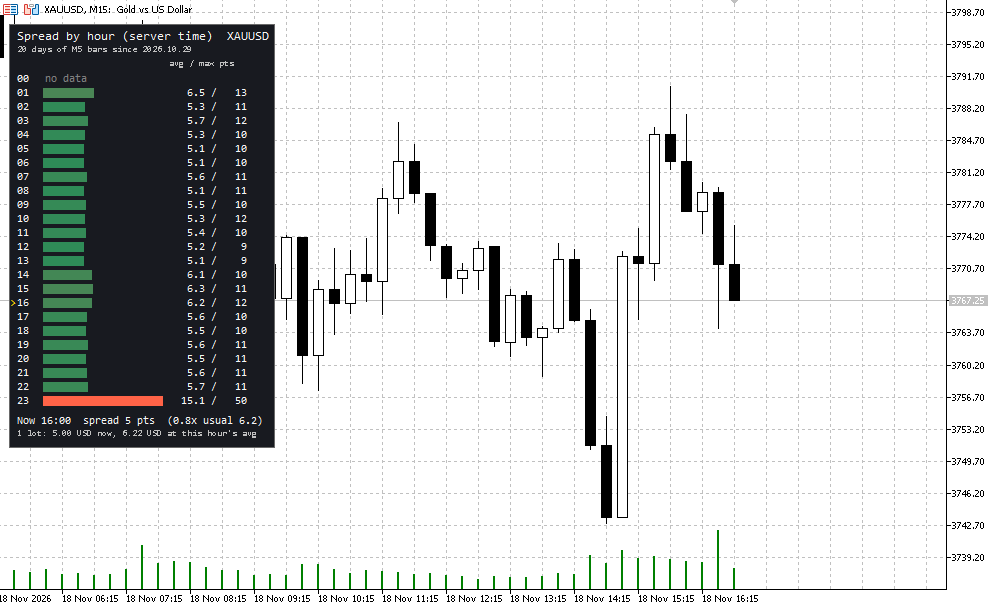
Spread By Hour shows the average and maximum spread for each hour of the day (broker server time), calculated from the symbol's own bar history, as a compact panel on the chart. Below the table it compares the current spread with the usual spread of the current hour and shows the spread cost of 1 lot in the account currency.
It answers a simple question that matters for every intraday strategy: at which hours is trading on this symbol cheap, and at which hours does the spread blow up at my broker? On the screenshot (gold, 20 days of M5 bars) the spread is about 5-6 points most of the day, but around the daily rollover hour it averages 15 points with spikes to 50.
How it works
- Reads the bars of the last InpDays days on the timeframe InpTF (M5 by default) with CopyRates and groups the bar spread by server hour (0-23).
- Each hour gets a bar coloured from green (cheapest hours) to red (most expensive), with the average and maximum spread in points. Hours without data (market closed) are shown as "no data".
- The current hour is marked with ">". The live line turns red when the current spread is more than 1.5 times the usual spread of this hour.
- Cost of 1 lot = spread in points converted with the symbol's tick value and tick size, in the account currency.
- The table is recalculated every 10 minutes; the live line updates on every tick. If the history is not loaded yet, it retries every second.
- Optional CSV export of the table to MQL5\Files\SpreadByHour_<symbol>.csv.
Example
Gold (XAUUSD), M15 chart, 20 days of M5 bars:
Inputs
- InpDays (20) - days of history to analyse.
- InpTF (M5) - timeframe of the bars used for the statistics (H1 or lower; M1 gives the most detail).
- InpSkipZero (true) - ignore bars with spread 0 (no data).
- InpExportCSV (false) - write the table to a CSV file.
- InpX / InpY / InpBarWidth - position and size of the panel.
- InpLowColor / InpHighColor / InpTextColor / InpBgColor - colours.
Notes
- MetaTrader stores one spread value per bar, and many brokers store the lowest spread of the bar. Treat the averages as a floor: the spread you actually pay at a given moment can be higher, which is why the live line is shown next to the history.
- Hours are broker server time, so they shift when the broker changes daylight saving time.
- The indicator only draws chart objects (prefix SPRH_), has no buffers, and removes its objects when deleted.
Heikin Ashi Candles Drawn as a Chart Overlay
Heikin Ashi candles drawn as an overlay directly on the price chart, with optional hiding of the original candles (restored when the indicator is removed) and an on-chart label showing the trend, its strength and the run length.
 H4 Breakout Retest EA for Gold (XAUUSD)
Gold EA: breakout of the first H4 candle with confirmation via a retest, fixed percentage stop and target, risk-based lot size and drawdown protection.
 Market Hours Label - is the symbol open now and when it closes
Small label on the chart. the symbol is open or closed now, the time left to the close or to the next open, and the sessions of today. It reads the trade sessions of your broker. Display only.
Trend Strength Meter Using ADX in a Compact Dashboard
A compact on-chart dashboard that shows the trend strength of up to four timeframes using the ADX: value, strength bar, strength class and +DI/-DI direction, plus a summary row with the average ADX and the agreement of the directions.