 MetaTrader 5
 Experts
 Indicators
 Scripts
 Libraries
 Storage
Watch how to download trading robots for free
Find us on Telegram!
Join our fan page
Join our fan page
You liked the script? Try it in the MetaTrader 5 terminal

Trend Strength Meter Using ADX in a Compact Dashboard - indicator for MetaTrader 5

- Views:
- 84
- Rating:
- Published:
-
 You are missing trading opportunities:
- Free trading apps
- Over 8,000 signals for copying
- Economic news for exploring financial markets
Registration Log inYou agree to website policy and terms of use
If you do not have an account, please register -
 Need a robot or indicator based on this code? Order it on Freelance
Go to Freelance

Trend Strength Meter Using ADX in a Compact Dashboard
The idea behind it
The Average Directional Index (ADX) by J. Welles Wilder measures how strong a trend is, regardless of its direction. Low values mean that price is ranging; rising values mean that a directional move is developing. The two companion lines, +DI and −DI, show which side is currently stronger.
Checking several timeframes one by one means switching charts. This indicator reads the standard iADX indicator for up to four timeframes and presents the result in one small panel in the corner of the chart. Each row answers three questions at a glance: how strong is the trend, is it bullish or bearish, and do the timeframes agree?
The strength class is derived from three configurable ADX levels: below InpLevelWeak there is no trend, from InpLevelWeak the trend is weak, from InpLevelStrong it is strong, and from InpLevelVeryStrong it is very strong.
How to interpret it
- TF – the timeframe of the row. The last row, ALL, is the summary.
- ADX value – the ADX of the row's timeframe (the last closed bar by default).
- Strength bar – a horizontal bar whose length is proportional to the ADX (full length at ADX 50). Its color shows the strength class: no trend, weak, strong or very strong.
- Strength class – the text of the class: No trend, Weak, Strong or Very strong.
- Direction – ▲ Bull when +DI is above −DI, ▼ Bear when −DI is above +DI. Direction is only meaningful when the strength is not "No trend".
- Summary row (ALL) – the average ADX of all rows with available data and its class. The direction shows Bull or Bear only if all timeframes point the same way; otherwise it shows Mixed.
- n/a and -- – the data of that timeframe is not available yet (history is still loading); the dashboard retries automatically.
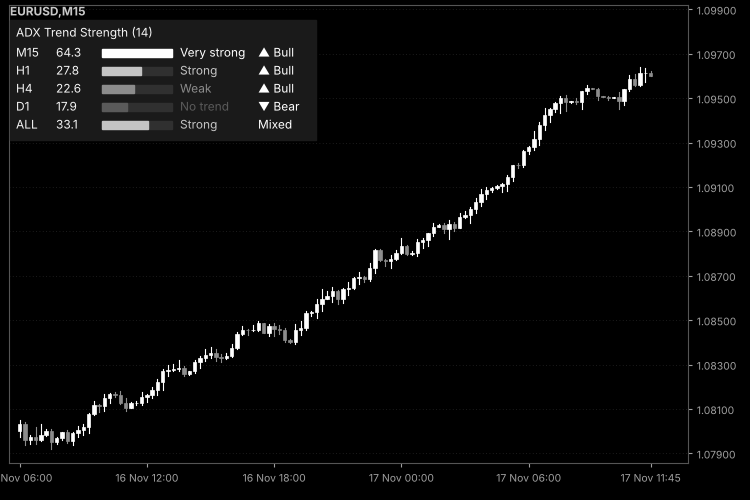
Fig. 1. ADX Trend Strength dashboard for M15, H1, H4 and D1 with the summary row on an M15 chart; black & white image per Code Base image guidelines (colors are configurable).
External variables (inputs)
| Input | Default | Purpose |
|---|---|---|
| InpADXPeriod | 14 | Period of the ADX (2 or more). |
| InpUseClosedBar | true | true: values of the last closed bar (stable, updated when a new bar of that timeframe opens); false: values of the forming bar (updated up to four times per second). |
| InpTF1 | PERIOD_M15 | Timeframe of row 1 (PERIOD_CURRENT = chart timeframe). |
| InpTF2 | PERIOD_H1 | Timeframe of row 2. |
| InpTF3 | PERIOD_H4 | Timeframe of row 3. |
| InpTF4 | PERIOD_D1 | Timeframe of row 4. |
| InpLevelWeak | 20.0 | ADX value from which the trend is classified as weak. |
| InpLevelStrong | 25.0 | ADX value from which the trend is classified as strong. |
| InpLevelVeryStrong | 40.0 | ADX value from which the trend is classified as very strong. Levels must satisfy 0 < weak < strong < very strong < 100. |
| InpShowTitle | true | Shows the title row. |
| InpShowSummary | true | Shows the summary row (average ADX and direction agreement). |
| InpX | 10 | Distance of the dashboard from the left chart edge, in pixels. |
| InpY | 20 | Distance of the dashboard from the top chart edge, in pixels. |
| InpFontSize | 9 | Font size (7–14). The whole dashboard scales with it. |
| InpBackColor | C'20,24,32' | Background color of the panel. |
| InpTextColor | clrWhiteSmoke | Color of the texts and ADX values. |
| InpBullColor | clrLimeGreen | Color of the bullish direction. |
| InpBearColor | clrTomato | Color of the bearish direction. |
| InpColorNoTrend | clrGray | Color of the strength bar and text for "No trend". |
| InpColorWeak | clrGoldenrod | Color for "Weak". |
| InpColorStrong | clrDodgerBlue | Color for "Strong". |
| InpColorVeryStrong | clrOrange | Color for "Very strong". |
Recommended use
- Symbols and timeframes: works on any symbol. The default rows (M15, H1, H4, D1) suit an intraday chart; choose timeframes from the one you trade up to the one that defines the larger trend. The chart timeframe itself does not matter, the indicator can sit on any chart of the symbol.
- Reading the dashboard: a common approach is to look for agreement – strong trends in the same direction on several timeframes – and to be cautious when higher timeframes show "No trend" or the summary is "Mixed". ADX does not predict reversals: it is a lagging measure, and it can fall while price still trends slowly.
- Levels: 20 and 25 are widely used thresholds; the "very strong" level of 40 is a convention, not a rule. Adjust all three levels to the instrument and to your own testing.
- Closed or forming bar: the closed-bar mode does not repaint and is the recommended default. The forming-bar mode reacts faster, but its values can change until the bar closes.
- History: the ADX of every timeframe needs enough bars. If a timeframe has not been opened yet, the terminal loads its history in the background and the row shows "n/a" until the data arrives.
- Efficiency: the indicator has no price history to recalculate. It keeps one iADX handle per row, reads three values per row, and refreshes a row only when a new bar of that timeframe opens (or four times per second in forming-bar mode); the objects are redrawn only when a value changes.
- Account types: the indicator does not trade and works identically on netting and hedging accounts.
- All objects (panel, labels, bars) carry a unique prefix and are removed, and the indicator handles are released, when the indicator is deleted or reinitialized. The dashboard is a tool for context; combine it with your own entry rules and risk management.
 Market Hours Label - is the symbol open now and when it closes
Small label on the chart. the symbol is open or closed now, the time left to the close or to the next open, and the sessions of today. It reads the trade sessions of your broker. Display only.
Spread By Hour - average and max spread per hour, live spread vs usual
Average and maximum spread for each server hour from bar history, live spread vs the usual spread of this hour, and the spread cost of 1 lot.
Building a Confluence Signal Engine in MQL5: Leading Triggers, Confirmation Filters and a Live Dashboard
Free source code included: a DST-aware Market Sessions + PVSRA vector-candle indicator, 5 preset files and a printable confluence cheat sheet.
 Trade Settings — Persist and Migrate Per-Trade Settings
Standalone MQL5 library for storing custom settings separately for each trade and following a verified pending-order-to-position lifecycle. It supports double, ulong and price-unit fields, terminal-local Global Variables, safe cleanup gates and an offline self-test. Includes a demo EA, source archive, and installation guide. A different-ticket transition, reconnection as a separate scenario, and netting behavior remain untested.