 MetaTrader 5
 Experts
 Indicators
 Scripts
 Libraries
 Storage
Watch how to download trading robots for free
Find us on Telegram!
Join our fan page
Join our fan page
You liked the script? Try it in the MetaTrader 5 terminal

Relative Volume (RVOL) Indicator in a Subwindow - indicator for MetaTrader 5

- Views:
- 81
- Rating:
- Published:
-
 You are missing trading opportunities:
- Free trading apps
- Over 8,000 signals for copying
- Economic news for exploring financial markets
Registration Log inYou agree to website policy and terms of use
If you do not have an account, please register -
 Need a robot or indicator based on this code? Order it on Freelance
Go to Freelance

Relative Volume (RVOL) Indicator in a Subwindow
The idea behind it
Raw volume bars are hard to judge: is 1,800 ticks a lot or a little? It depends on the symbol, the timeframe and the time of day. Relative Volume answers that question by comparing a bar with what is normal for it:
RVOL = volume of the bar / average volume
A value of 1.0 means "as usual", 2.0 means twice the usual volume, 0.5 means half of it. Unusually high RVOL shows that the market is paying attention: news, breakouts, stop runs and the start or end of a trend usually come with it. A breakout on low RVOL is more likely to fail than the same breakout on high RVOL.
The "usual" volume can be measured in two ways:
- Previous N bars: the average of the N bars before the current one. Works on every timeframe.
- Same time of day, previous N days: the average volume of the bars that opened at the same time on the previous N trading days. Intraday volume has a strong daily rhythm (quiet Asian hours, busy London and New York opens), and this mode removes it, so the opening hour is not always flagged as "high".
The calculation is incremental: after the first pass only the last bar and new bars are recalculated on each tick.
How to interpret it
- Histogram: one bar per candle, showing RVOL of that candle. The subwindow scale starts at 0.
- Three colors: the normal color for RVOL below the high level, the second color for RVOL at or above the high level (elevated activity), the third color for RVOL at or above the extreme level (exceptional activity).
- Dotted horizontal levels: 1.0 (average volume), the high level and the extreme level.
- Text label in the upper left corner of the subwindow: RVOL of the last closed bar with its status (normal, HIGH or EXTREME), and RVOL of the live bar.
- The volume of the live (still forming) bar is incomplete, so its RVOL starts near 0 and grows during the bar. Judge a signal by the closed bar; the live value shows how the current bar is developing.
- Bars for which there is not enough history for the average are left empty: the first N bars in the "Previous N bars" mode, and bars with fewer than 3 days (or fewer than N days if N is smaller than 3) of data in the same-time mode.
- Typical readings: a high RVOL bar with a large range suggests real participation behind the move; a high RVOL bar with a small range suggests absorption; a breakout with RVOL near or below 1.0 is a weak one.
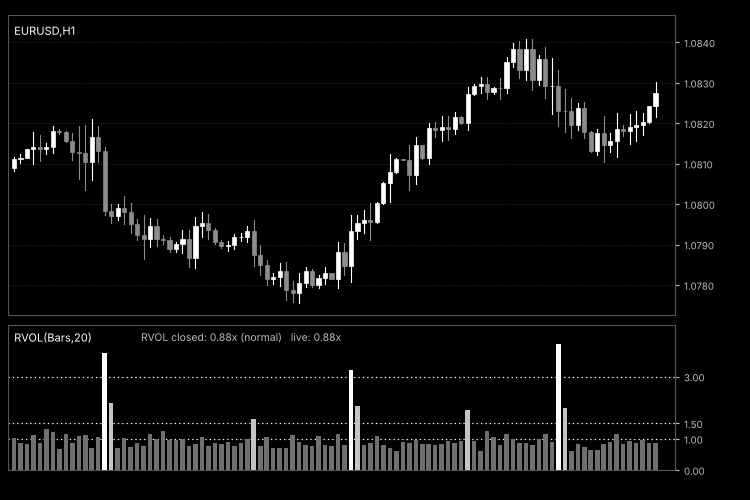
Fig. 1. RVOL(Bars,20) in the subwindow of an EURUSD H1 chart: histogram with the 1.0, high and extreme levels and the text label. The image is black & white according to the Code Base image guidelines; the three histogram colors are configurable.
External variables (inputs)
| Input | Default | Purpose |
|---|---|---|
| Baseline | ||
| InpMode | RVOL_MODE_BARS | How the average volume is measured: previous N bars (RVOL_MODE_BARS) or same time of day on the previous N days (RVOL_MODE_SAME_TIME). The same-time mode needs an intraday timeframe; on D1 and above the indicator uses the previous N bars instead and prints a message in the Experts tab. |
| InpPeriod | 20 | N: number of bars (bars mode) or number of days (same-time mode) in the average. Must be at least 1. |
| InpVolumeType | RVOL_VOL_TICK | Volume used in the calculation: tick volume or real volume. If a bar has no real volume, its tick volume is used. |
| Levels | ||
| InpHighLevel | 1.5 | RVOL level from which volume is considered elevated (second histogram color, dotted level line). Must be greater than 0. |
| InpExtremeLevel | 3.0 | RVOL level from which volume is considered extreme (third histogram color, dotted level line). Must not be lower than the high level. |
| Colors and label | ||
| InpColorNormal | clrGray | Histogram color for RVOL below the high level. |
| InpColorHigh | clrDodgerBlue | Histogram color for RVOL at or above the high level. |
| InpColorExtreme | clrOrangeRed | Histogram color for RVOL at or above the extreme level. |
| InpShowLabel | true | Shows the text label with the RVOL of the last closed bar and of the live bar in the subwindow. |
| InpLabelColor | clrGray | Color of the text label. |
Recommended use
- Intraday charts (M1 to H4). Prefer RVOL_MODE_SAME_TIME : it compares a bar with the same hour of the previous days, so the normal daily volume pattern does not distort the picture. Bars at the start of the history and bars right after a long gap have fewer comparison days and may be empty or less reliable.
- Daily and higher charts. Use RVOL_MODE_BARS . N = 20 is roughly one trading month on D1.
- Choosing N. A small N reacts quickly to changes in activity but is noisy; a large N gives a stable baseline but reacts slowly after a regime change.
- Volume source. On Forex and CFD symbols the terminal provides tick volume only, which is a proxy for activity and not for traded lots, and it can differ between brokers. On exchange symbols with real volume, set InpVolumeType to RVOL_VOL_REAL .
- Levels. The default 1.5 and 3.0 are only starting points. Look at the history of your symbol and set the levels so that the extreme color marks only a few percent of the bars.
- Several instances. You can attach the indicator more than once with different settings; each copy creates its own label, named after its mode and N.
- Chart objects. The indicator creates one text label (when InpShowLabel is enabled) and deletes it when the indicator is removed or reloaded.
- Account types. It is a visual indicator: it does not trade, does not need DLLs and works the same on netting and hedging accounts.
- RVOL is a context filter, not a signal by itself. Use it together with price action, levels or your own entry rules.
Point of Control (POC) and Value Area Lines for the Day
Builds a volume profile for every day and draws its Point of Control (POC) and the Value Area boundaries (VAH and VAL) as horizontal lines on the chart. The levels of the current day are updated as the day develops.
Symmetrical Triangle Detector - objective, non-repainting triangle rules with Gann box
Detects horizontal symmetrical triangles with objective, non-repainting rules (pivot zigzag, 3+2 touches, symmetry, no wicks or bodies breaking the lines) and draws them to the apex with breakout arrows and an optional Gann box.
Accelerator Oscillator (AC)
The Acceleration/Deceleration Indicator (AC) measures acceleration and deceleration of the current driving force.
MACD Signals
Indicator edition for new platform.