 MetaTrader 5
 Experts
 Indicators
 Scripts
 Libraries
 Storage
Watch how to download trading robots for free
Find us on Facebook!
Join our fan page
Join our fan page
You liked the script? Try it in the MetaTrader 5 terminal

Point of Control (POC) and Value Area Lines for the Day - indicator for MetaTrader 5

- Views:
- 80
- Rating:
- Published:
-
 You are missing trading opportunities:
- Free trading apps
- Over 8,000 signals for copying
- Economic news for exploring financial markets
Registration Log inYou agree to website policy and terms of use
If you do not have an account, please register -
 Need a robot or indicator based on this code? Order it on Freelance
Go to Freelance

Point of Control (POC) and Value Area Lines for the Day
The idea behind it
Price spends more time and trades more volume at some prices than at others. A volume profile shows this: the day's price range is divided into rows and the volume traded in each row is summed up. From this profile three levels are taken:
- POC (Point of Control) – the row with the highest volume, i.e. the price that the market accepted most during the day.
- Value Area – the price range around the POC that holds a given share of the day's volume (70% by default). Its upper boundary is VAH (Value Area High), its lower boundary is VAL (Value Area Low).
Many traders treat these levels as a map of "fair value": price tends to be attracted by the POC, to react at VAH and VAL, and a sustained move outside the Value Area signals that the market is searching for a new balance.
The indicator needs no separate volume-profile data. It spreads the volume of every bar evenly over the price rows between the bar's Low and High, adds the bars of the day together and derives the levels. The Value Area is found with the usual method: starting at the POC, the pair of rows above or below that holds more volume is added, until the required share of the total volume is reached.
How to interpret it
- POC line (solid, thick) – the price with the highest volume of the day.
- VAH and VAL lines (dashed) – the upper and lower boundaries of the Value Area (InpValueAreaPercent of the day's volume).
- Completed days – the lines span the day, from its first bar to its last bar, and use the final profile of that day. These levels are useful as reference levels on following days; hover over a line to see its price and date in the tooltip.
- Current day – the lines are recalculated with every tick, so they show the developing POC and Value Area. If InpExtendToday is enabled, they are extended to the right, and price labels (POC, VAH, VAL) are placed at the end of the lines.
- Optional rectangle – with InpFillValueArea the Value Area of every day is also shown as a filled rectangle between VAL and VAH.
- Price relative to the Value Area – trading inside the Value Area suggests balance; acceptance above VAH or below VAL suggests a directional move, while a quick return into the Value Area is often read as a failed breakout.
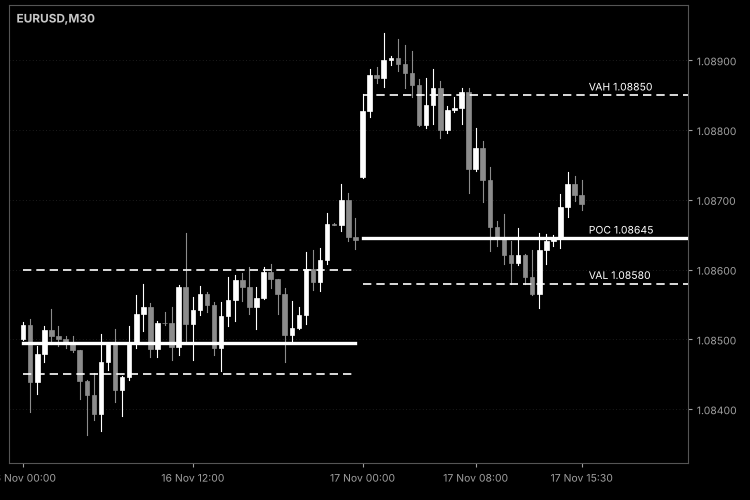
Fig. 1. Daily POC (solid), VAH and VAL (dashed) on an M30 chart: the completed day and the developing levels of the current day with price labels; black & white image per Code Base image guidelines (colors are configurable).
External variables (inputs)
| Input | Default | Purpose |
|---|---|---|
| InpDays | 5 | Number of days (including the current one) for which the levels are calculated and displayed. |
| InpSessionStartHour | 0 | Hour at which a new day starts, in server time (0–23). |
| InpBinPoints | 10 | Height of one profile row in points. Smaller values give a finer profile; larger values a smoother one. |
| InpValueAreaPercent | 70.0 | Share of the day's volume that the Value Area must contain (1–100). |
| InpVolume | VOLUME_TICK | Volume used as weight: tick volume or real volume (if the broker provides it). |
| InpFillValueArea | false | Draws a filled rectangle between VAL and VAH for every day. |
| InpExtendToday | true | Extends the lines of the current day to the right. |
| InpShowLabels | true | Shows price labels of POC, VAH and VAL for the current day. |
| InpPOCColor | clrDarkOrange | Color of the POC line and its label. |
| InpVAColor | clrDodgerBlue | Color of the VAH and VAL lines and their labels. |
| InpFillColor | clrLightSteelBlue | Color of the Value Area rectangle. |
| InpPOCWidth | 2 | Width of the POC line (1–5). |
Recommended use
- Timeframes: use a timeframe below D1, typically M5–H1. The profile is built from bars, so lower timeframes distribute the volume more accurately across prices. On D1 and above each day is a single bar and the indicator prints a warning.
- Row height: InpBinPoints is given in points of the symbol, so adjust it to the instrument: 10 points is one pip on a 5-digit forex symbol, but a very different distance on gold, indices or cryptocurrencies. As a rule of thumb, aim for roughly 30–100 rows over a typical daily range.
- Volume: forex and CFD symbols normally provide tick volume only, which is a reasonable proxy for activity. Real volume is meaningful on exchange-traded instruments.
- Day boundaries: the day starts at InpSessionStartHour in server time. Adjust it to the market of interest. Brokers that provide Sunday bars will show a short, separate "day" for them.
- Caveats: the profile is an approximation: the volume of each bar is distributed evenly between its Low and High, because the real distribution inside a bar is not available from bar data. The levels of the current day change until the day is complete, and the levels of completed days are calculated from the whole day (they are not "as seen at the time"). If the day's price range exceeds the internal profile size for the chosen row height, prices outside it are clipped and a message is written to the Experts log; increase InpBinPoints in this case.
- Efficiency: closed bars are added to the profile only once; on each tick only the forming bar is added temporarily to update the current day's levels, so history is not rescanned. Objects of days older than InpDays are deleted automatically.
- Account types: the indicator does not trade and works identically on netting and hedging accounts.
- All chart objects (lines, rectangles, labels) carry a unique prefix and are removed when the indicator is deleted or reinitialized. Use the levels as additional context together with your own entry rules and risk management.
Symmetrical Triangle Detector - objective, non-repainting triangle rules with Gann box
Detects horizontal symmetrical triangles with objective, non-repainting rules (pivot zigzag, 3+2 touches, symmetry, no wicks or bodies breaking the lines) and draws them to the apex with breakout arrows and an optional Gann box.
Warm-Up Meter: Measuring Seed Convergence of Recursive Indicators
Part 2 of the indicator regression-testing series. Measures how many bars of history a recursive indicator (EMA, Wilder smoothing, or a cascade of up to three stages) needs before the error left by its starting value falls below a tolerance and recommends a safe warm-up length.
Relative Volume (RVOL) Indicator in a Subwindow
Relative Volume (RVOL) in a subwindow: the volume of every bar divided by its normal volume, drawn as a color-coded histogram with reference levels and a live text label.
MACD Signals
Indicator edition for new platform.