 MetaTrader 5
 Experts
 Indicators
 Scripts
 Libraries
 Storage
Watch how to download trading robots for free
Find us on Telegram!
Join our fan page
Join our fan page
You liked the script? Try it in the MetaTrader 5 terminal

Symmetrical Triangle Detector - objective, non-repainting triangle rules with Gann box - indicator for MetaTrader 5
Augusto Martin D'anna

MQL5 & Pine Script developer | Trader since 2019 | Strategy validation
As a trader, I know a bot is only as good as the logic behind it. I bridge
trading concepts and clean code: I don't just follow instructions, I make
sure your EA behaves exactly the way your strategy intends.
As a trader, I know a bot is only as good as the logic behind it. I bridge
trading concepts and clean code: I don't just follow instructions, I make
sure your EA behaves exactly the way your strategy intends.
- Views:
- 74
- Rating:
- Published:
-
 You are missing trading opportunities:
- Free trading apps
- Over 8,000 signals for copying
- Economic news for exploring financial markets
Registration Log inYou agree to website policy and terms of use
If you do not have an account, please register -
 Need a robot or indicator based on this code? Order it on Freelance
Go to Freelance

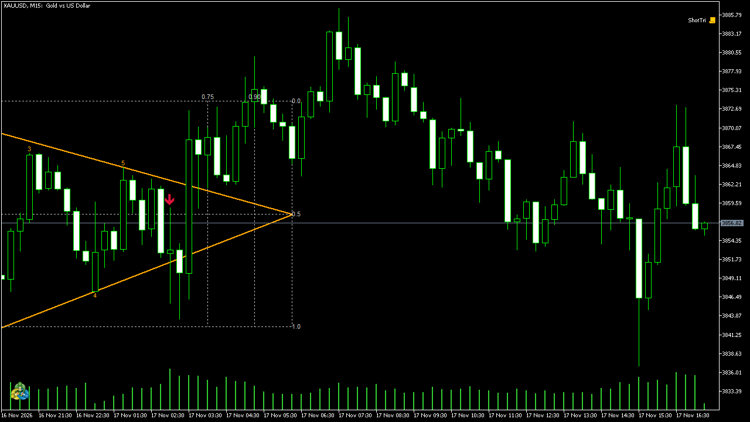 Most traders draw triangles by eye. This indicator detects horizontal symmetrical triangles with fixed, measurable rules, so the same chart always gives the same triangles. It works on closed bars only and does not repaint. It is a port of my open-source TradingView script with the same detection rules.
Detection rules
- Pivots with N bars on each side, joined in an alternating zigzag (two highs in a row keep the higher, two lows keep the lower).
- The last 4 to 8 pivots: upper line through the first and last high, lower line through the first and last low; the other pivots must stay inside.
- At least 3 touches on one line and 2 on the other (touch = pivot within the tolerance of its line).
- Symmetric: the upper line falls, the lower line rises, the steeper slope is at most RatioMax times the flatter one.
- Horizontal: the middle axis moves less than AxisPct % of the initial height; compact: limited slope and height in ATR.
- Clean: no wick or body breaks the lines between the first and the last touch, and at least FillPct % of the candles reach a line.
- The apex is ahead of the last touch and no farther than ApexK times the pattern width.
The pattern ends at the first wick out of the lines (or a close outside from the 0.75 time mark on), marked with an arrow, or at the apex. The optional Gann box goes from the first touch to the apex (price 0 / 0.5 / 1, time 0.75 and 0.9).
Implementation notes
- Bars are processed once each, in chronological order, so the history and live bars follow exactly the same logic.
- All thresholds are multiples of Wilder ATR(14), so the inputs work on any market and timeframe.
- Everything is drawn with chart objects (prefix STRI_), removed when the indicator is removed.
This is a pattern detection tool, not a trading signal: in my tests, trading these breakouts had no edge after costs.
Warm-Up Meter: Measuring Seed Convergence of Recursive Indicators
Part 2 of the indicator regression-testing series. Measures how many bars of history a recursive indicator (EMA, Wilder smoothing, or a cascade of up to three stages) needs before the error left by its starting value falls below a tolerance and recommends a safe warm-up length.
 Risk Percent Lot Size Calculator
Script that calculates the lot size for a given risk percent and stop loss. Places no orders.
Point of Control (POC) and Value Area Lines for the Day
Builds a volume profile for every day and draws its Point of Control (POC) and the Value Area boundaries (VAH and VAL) as horizontal lines on the chart. The levels of the current day are updated as the day develops.
Relative Volume (RVOL) Indicator in a Subwindow
Relative Volume (RVOL) in a subwindow: the volume of every bar divided by its normal volume, drawn as a color-coded histogram with reference levels and a live text label.