 MetaTrader 5
 Experts
 Indicators
 Scripts
 Libraries
 Storage
Watch how to download trading robots for free
Find us on Facebook!
Join our fan page
Join our fan page
You liked the script? Try it in the MetaTrader 5 terminal

- Views:
- 48
- Rating:
- Published:
-
 You are missing trading opportunities:
- Free trading apps
- Over 8,000 signals for copying
- Economic news for exploring financial markets
Registration Log inYou agree to website policy and terms of use
If you do not have an account, please register -
 Need a robot or indicator based on this code? Order it on Freelance
Go to Freelance


Not every support or resistance line deserves the same attention. Thanos AI Level Strength draws the unbroken swing highs and lows of a timeframe you choose (1 hour by default) and shades each one by its strength: pale levels are weak, deep and thick levels are strong. The score comes from two simple facts about each level, its age and the number of times it has held, both explained below.
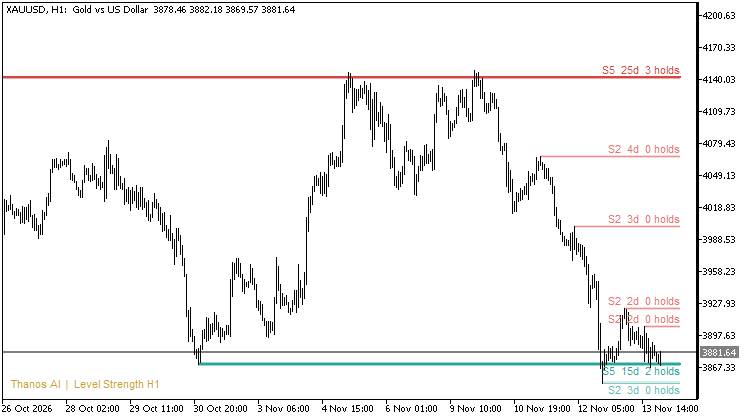
Figure 1. Thanos AI Level Strength on XAUUSD H1. The deep red line at the top is a 25-day-old level with 3 holds (S5).
Strength score
- Age. A level older than a day earns a point. A level older than a week earns a second point.
- Holds. Each time price came back to the level and was clearly turned away counts as a hold. One hold earns a point, two or more earn a second.
- Score. Every unbroken level starts at 1, so the total runs from 1 (pale) to 5 (deep).
The label at the right edge shows the score as text. For example, S4 6d 2 holds means strength 4, six days old, two holds. Hover over any level to see its exact price, age, holds and score. A level is removed as soon as price closes clearly through it, so everything on the chart is still intact.
How it works
- Swing: a bar whose high (or low) is the extreme of the bars on both sides (Swing bars each side, default 5).
- Test: a later bar comes within 0.1 ATR of the level from the inside.
- Hold: after a test, price closes 0.7 ATR away from the level within 12 bars, before it closes 0.3 ATR through it.
- Broken: a close 0.3 ATR through during a test, or 0.5 ATR through at any other time. Broken levels disappear.
- ATR is the 14-bar average true range of the level timeframe. Levels closer together than about a third of an ATR are merged, and the stronger one is kept.
- Closed bars only: a level never changes because of the bar that is still forming, so the indicator does not repaint.
Why age and holds?
We studied more than 17,000 one-hour swing levels on gold, from 2004 to 2026, and how price reacted each time it returned to them. Levels that had already held were turned away more often on the next test than levels being tested for the first time, and levels older than a week did better than swings less than a day old. The same ordering appeared in each of the four periods we checked (2004-09, 2010-14, 2015-19 and 2020-26), so the common belief that "each test weakens a level" did not show up in that data.
The indicator puts that finding on your chart. It describes past price behaviour; it is not a trading signal and does not predict the next move. Use it to judge which nearby levels have earned some respect, alongside your own method. It works on any symbol, including forex, metals, indices and crypto, places no trades and needs no DLLs or web access. Free tool from the developer of Thanos AI.
Inputs
- Level timeframe: where swings are found (default H1). Works on any chart timeframe; try H4 or D1 for swing trading.
- Swing bars each side: bars that must sit on each side of a swing (default 5). Higher values give fewer, bigger swings.
- History bars: how far back to search on the level timeframe (default 2000).
- Levels per side: how many of the nearest levels to draw above and below price (default 5).
- Min strength (1-5): hide levels below this score. Set it to 3 to see only seasoned levels.
- Resistance colour / Support colour: base colours of the zones.
- Show labels / Show Thanos AI tag: turn the text on the chart on or off.
Trading involves substantial risk of loss and is not suitable for every investor. This indicator is an analysis aid only; past price behaviour does not guarantee future results.
 Spread and Cost Monitor Panel
A panel showing the current spread, the average spread since the indicator was attached and the spread cost of a 1-lot trade in account currency.
Trading Session Range Boxes
Draws the Tokyo, London and New York trading sessions as coloured boxes that span the high and low of each session.
Accelerator Oscillator (AC)
The Acceleration/Deceleration Indicator (AC) measures acceleration and deceleration of the current driving force.
MACD Signals
Indicator edition for new platform.