 MetaTrader 5
 Experts
 Indicators
 Scripts
 Libraries
 Storage
Join our fan page

Stationarity: KPSS, Phillips-Perron, DF-GLS, Zivot-Andrews and variance ratio tests - library for MetaTrader 5

- Prop Risk Guard: daily loss and drawdown limits for prop firm accounts
- TradeMirror: local trade copier between MT5 accounts
- Views:
- 68
- Published:
-
 You are missing trading opportunities:
- Free trading apps
- Over 8,000 signals for copying
- Economic news for exploring financial markets
Registration Log inYou agree to website policy and terms of use
If you do not have an account, please register -
 Need a robot or indicator based on this code? Order it on Freelance
Go to Freelance
Stationarity.mqh has five tests that tell a random walk from a series that comes back to its mean, beyond the augmented Dickey-Fuller test: KPSS (whose null is the other way round: stationarity), Phillips-Perron, DF-GLS of Elliott, Rothenberg and Stock (more power than ADF near a unit root), Zivot-Andrews (a unit root against a stationary series with one structural break, with the date of the break) and the Lo-MacKinlay variance ratio. Every test gives its statistic, p-value, critical values at 1%, 5% and 10%, and the lags or bandwidth used. No DLL.
Usage
#include <Stationarity\Stationarity.mqh>

vector y;                                  // for example log prices
// ... fill y ...
SStationarityResult r;
if(CStationarity::KPSS(y, r, ST_TREND_CONSTANT))                 // null: stationary
   PrintFormat("KPSS %.3f, p-value %.3f, bandwidth %d", r.stat, r.pvalue, r.lags);
if(CStationarity::DFGLS(y, r, ST_TREND_LINEAR))                  // null: unit root
   PrintFormat("DF-GLS %.3f, p-value %.3f, %d lags", r.stat, r.pvalue, r.lags);
if(CStationarity::PhillipsPerron(y, r))
   PrintFormat("Phillips-Perron %.3f, p-value %.3f", r.stat, r.pvalue);
if(CStationarity::ZivotAndrews(y, r, ZA_BREAK_BOTH))             // unit root against one break
   PrintFormat("Zivot-Andrews %.3f, p-value %.3f, break at bar %d", r.stat, r.pvalue, (int)r.extra);
if(CStationarity::VarianceRatio(y, r, 10))                       // random walk?
   PrintFormat("VR(10) %.3f, p-value %.3f", r.extra, r.pvalue);
The tests
- KPSS, constant or trend: bandwidth chosen automatically (Hobijn, Franses and Ooms), or 12 (n/100)^(1/4), or given. p-values by interpolation in the simulated quantiles.
- PhillipsPerron, no constant, constant or trend: Z-tau or Z-rho, Newey-West long-run variance, MacKinnon p-values and critical values.
- DFGLS, constant or trend: the series is detrended by GLS with c = -7 or -13.5, the lag chosen by AIC, BIC or t-statistic on the OLS-detrended series.
- ZivotAndrews: break in the level, in the trend, or both, every date between the trimmed ends (15% by default); the regression at each date reuses the cross-products of the columns that do not move, so 2 800 bars take about 0.1 s.
- VarianceRatio: q-period against 1-period variance, overlapping or not, debiased, with the heteroskedasticity robust variance of Lo and MacKinlay. The ratio is in r.extra; below 1 means mean reversion, above 1 momentum.
- SelectLags (the lag search of the Dickey-Fuller regression) and the DickeyFullerP / DickeyFullerCrit functions for t and normalized bias (z) statistics are public.
The tables of p-values and critical values are in StationarityTables.mqh.
Example
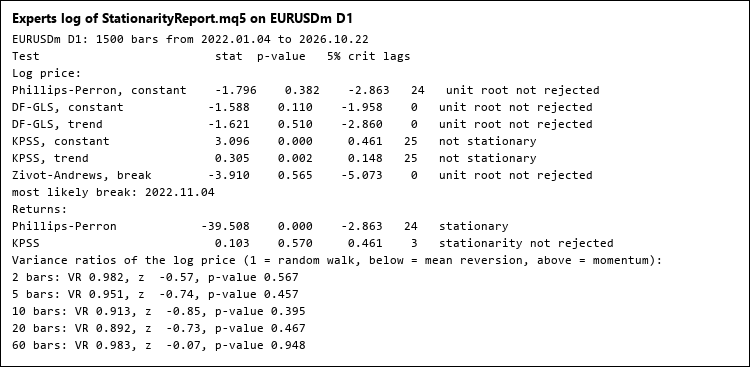
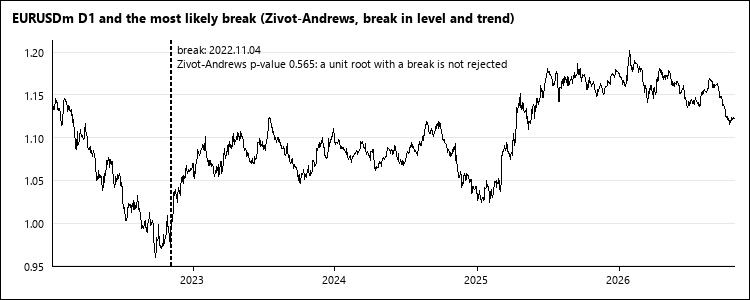
The script StationarityReport.mq5 runs the tests on the log price and on the returns of a symbol and prints each result with its verdict at 5%, the date of the most likely break, and the variance ratios at 2 to 60 bars (picture 1). On EURUSD D1 the price behaves as a random walk and the returns are stationary, as expected; the most likely break is November 2022, just after the low (picture 2).
Checked
Against arch 8.0 (arch.unitroot) on six series (a random walk, a stationary AR(1), a trend-stationary series, a series with a break in its level, the log price of gold on H4 and of BTCUSD on D1), 204 tests with every trend, lag rule and option:
- the same lags, bandwidths, numbers of observations, break dates and critical values;
- statistics within 3e-11 and p-values within 2e-11.
Files
Stationarity.mqh and StationarityTables.mqh go to MQL5\Include\Stationarity, StationarityReport.mq5 to MQL5\Scripts\Stationarity.
 Risk Lot Calculator - lot size from your risk and stop (class for EAs + chart panel)
Drag the stop-loss line and read the lot size that risks exactly your money or percent. The CRiskSizer class does the same in an EA: lot rounded down, minimum lot never forced, max lot, volume limit, stop level and margin checked.
Broker Time - server, UTC, New York, London, Sydney, Tokyo with the right summer time (class + session lines)
CBrokerTime converts server time, UTC, New York, London, Sydney and Tokyo with the real summer time of every year and finds your broker's clock from the history (also in the tester). The indicator draws session lines and a clock panel.
RealizedVol: range volatility estimators, realized variance and HAR forecasts
Parkinson, Garman-Klass, Rogers-Satchell and Yang-Zhang estimators, daily realized and bipower variance from intraday bars, and HAR volatility forecasts.
MACD Signals
Indicator edition for new platform.