 MetaTrader 5
 Experts
 Indicators
 Scripts
 Libraries
 Storage
Join our fan page

Risk Lot Calculator - lot size from your risk and stop (class for EAs + chart panel) - indicator for MetaTrader 5

I build and fix trading tools for MetaTrader 4 and MetaTrader 5:
• Expert Advisors (EAs) built from your strategy rules
• Custom indicators, alerts and on-chart panels
- Views:
- 96
- Rating:
- Published:
-
 You are missing trading opportunities:
- Free trading apps
- Over 8,000 signals for copying
- Economic news for exploring financial markets
Registration Log inYou agree to website policy and terms of use
If you do not have an account, please register -
 Need a robot or indicator based on this code? Order it on Freelance
Go to Freelance
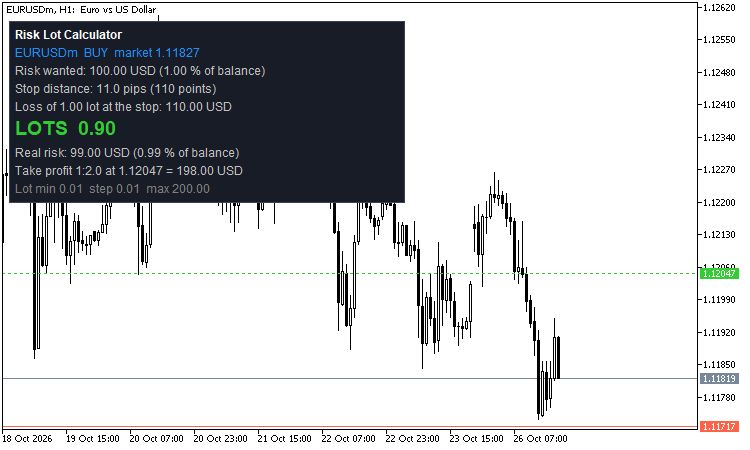 Most lot size code is one line: risk / (stop in pips x pip value). It breaks on gold, indices, crypto, JPY pairs, cent accounts and on symbols with a lot step of 0.1 or 0.5. This package is a small, tested class for that job and a chart panel that uses it.
Files
- RiskSizer.mqh - class CRiskSizer (copy to MQL5\Include or keep next to your EA).
- RiskLotPanel.mq5 - indicator: a stop-loss line you drag, a take-profit line, and a panel with the result. Put both files in the same folder to compile the indicator.
What the panel shows
- Symbol, direction (the stop below the price = buy, above = sell) and the entry price (market, or an entry line you drag for a pending order).
- The risk you want: percent of balance, equity or free margin, or a fixed amount in the account currency.
- Stop distance in points (and in pips for currency pairs), the loss of 1.00 lot at the stop.
- LOTS: the lot size, the real risk after rounding (in money and in percent), the profit at the take-profit line (reward / risk input).
- Warnings in plain words: the lot for this risk is below the minimum lot (and what the minimum lot would risk), cut to the maximum lot or to the volume the symbol still allows; the stop is closer than the broker's stop level; the stop is on the wrong side.
- Global variables RLP_<symbol>_LOTS / _SL / _TP / _BUY for a script or an EA that wants the numbers (input, on by default).
How the lot is found
- Loss of one lot at the stop: in an EA or script from OrderCalcProfit, so contract size, tick value and the conversion to the account currency come from the platform. OrderCalcProfit rounds its answer to cents, so the class asks for a big volume (100 lots or more) and divides - a small loss per lot (JPY crypto, some CFDs) stays exact.
- In an indicator the platform does not allow OrderCalcProfit and OrderCalcMargin (error 4014). There the class uses the tick formula: stop distance / tick size x tick value (loss). The margin is then not known and not checked.
- Lots = risk / (loss per lot + commission per lot), rounded DOWN to the volume step. The real risk is never above the wanted risk.
- A lot below the minimum is not silently raised: the result says so and shows what the minimum lot would risk. One input (or SetUseMinLot(true)) lets you accept the minimum lot on purpose.
- Cut to the maximum volume, to the volume limit of the symbol minus the volume already open and pending, and to the free margin (OrderCalcMargin, EA and script only).
- Commission per lot (round turn, account currency) can be added to the risk.
Use in an EA
#include <RiskSizer.mqh> CRiskSizer rs; ... rs.Init(_Symbol); // in OnInit; false = no data yet, try again SRsResult r; double risk = AccountInfoDouble(ACCOUNT_BALANCE) * 0.01; // 1 % double ask = SymbolInfoDouble(_Symbol, SYMBOL_ASK); if(rs.Calc(ORDER_TYPE_BUY, ask, stopPrice, risk, r)) trade.Buy(r.lots, _Symbol, ask, stopPrice, takeProfit); else Print(rs.Describe(r)); // why there is no lot
The result also has lotsExact (before rounding), riskActual, lossPerLot, stopDistance, marginNeeded, freeMarginAfter and riskOfMinLot. Other helpers: Base(), RoundDown(), LossPerLot(), MoneyAt(), MinLot(), MaxLot(), LotStep(), SetCommissionPerLot(), SetCheckMargin().
How it was tested (demo account, USD, 241 tradable symbols of the server: forex, metals, indices, crypto, stocks)
- 7,663 cases: every symbol, buy and sell, 4 stop distances, 4 risk amounts (0.01 to 1,000).
- The lot is a multiple of the volume step and inside the minimum and maximum lot.
- The loss at the stop for the chosen lot, asked again from OrderCalcProfit for that exact volume, is never above the wanted risk (cents rounding of the platform allowed), and one more step would be above it.
- Tick formula only (what an indicator uses): same lot as the platform in 7,635 of 7,656 cases, one volume step different in 21, never more; the loss at its lot is never above the risk.
- Edge cases: stop on the wrong side, zero distance, zero risk, minimum lot on request, risk too big for the free margin.
- Hand check: USDJPY 22.9 pips, 1 lot loses 145.49 USD, 1 % of 10,000 = 100 USD gives 0.68 lot. Gold: a 13.489 move x 100 oz = 1,348.90 USD per lot, 0.07 lot.
- The indicator was loaded in the Strategy Tester on EURUSD H1, XAUUSD D1, GBPUSD M30 and EURUSD M1 without errors.
Good to know
- All money is in the account currency (a cent account shows cents). Tested on a USD account; a different account currency works through the tick value of the symbol, which the broker already gives in the account currency.
- The tick value and the volume rules come from your broker. If a broker publishes a wrong tick value, the formula inherits it; in an EA the platform answer is used.
- It never trades. The indicator only draws and calculates.
- This is a calculator, not advice: the stop and the risk are your decision.
Broker Time - server, UTC, New York, London, Sydney, Tokyo with the right summer time (class + session lines)
CBrokerTime converts server time, UTC, New York, London, Sydney and Tokyo with the real summer time of every year and finds your broker's clock from the history (also in the tester). The indicator draws session lines and a clock panel.
Heikin Ashi Candles
A clean Heikin Ashi indicator that draws on the main chart window. It also adds one horizontal line at the average price, (Open + High + Low + Close) / 4, of the last closed candle of a chosen timeframe. By default this is H1, and the line uses the normal candles, not Heikin Ashi.
 Stationarity: KPSS, Phillips-Perron, DF-GLS, Zivot-Andrews and variance ratio tests
Five tests to tell a random walk from a mean-reverting series: KPSS, Phillips-Perron, DF-GLS, Zivot-Andrews with the break date, and the variance ratio.
RealizedVol: range volatility estimators, realized variance and HAR forecasts
Parkinson, Garman-Klass, Rogers-Satchell and Yang-Zhang estimators, daily realized and bipower variance from intraday bars, and HAR volatility forecasts.