 MetaTrader 5
 Experts
 Indicators
 Scripts
 Libraries
 Storage
Join our fan page

Market Behavior Analyzer: Swing Structure and Market Context - indicator for MetaTrader 5

I’m a developer and researcher working across algorithmic trading through MQL5 — building, experimenting, and turning curiosity into working ideas.
Still early.
Still building.
Still nowhere near done.
- Views:
- 44
- Rating:
- Published:
-
 You are missing trading opportunities:
- Free trading apps
- Over 8,000 signals for copying
- Economic news for exploring financial markets
Registration Log inYou agree to website policy and terms of use
If you do not have an account, please register -
 Need a robot or indicator based on this code? Order it on Freelance
Go to Freelance
Need a robot or indicator based on this code? Order it on Freelance
Go to Freelance
We present the Market Behavior Analyzer, an indicator built to turn raw price swings into a clearer and more structured view of market behavior.
Rather than displaying swing points alone, the indicator follows the movement between them and classifies the developing structure using Higher High (HH), Higher Low (HL), Lower High (LH), and Lower Low (LL) labels. Each completed move is measured in pips, while additional information such as the number of bars required and retracement percentage helps provide context around how the structure developed.
The indicator includes two interactive components. The Market Story panel provides a compact summary of the detected structure and whether the latest movement is being interpreted as an impulse or pullback. The Swing Inspector allows individual swing points to be selected directly from the chart to examine their price, classification, move length, duration, retracement, and neighboring swing relationships.
Main inputs
The Lookback & Swing settings control how much chart history is analyzed and how significant a price movement must be before it qualifies as a swing. InpLookbackCandles defines the historical analysis window, while InpDepth controls the number of surrounding candles used to confirm swing highs and lows. InpMinDistPoints can be used to filter swings that are too close together.
The Visual settings allow the swing structure to be presented according to preference. Swing lines and labels can be enabled or disabled independently, while the font size and colors used for impulses, pullbacks, and swing lows can also be adjusted.
The Market Story and Swing Inspector can each be enabled or disabled. Panel colors are configurable so the interface can be adapted to different chart themes without changing the underlying analysis.
The Market Behavior Analyzer is intended as an analysis and visualization tool. It does not generate trading signals or make trading decisions. Instead, it provides a structured way to inspect how price has moved, how individual swings relate to one another, and how the resulting market structure is developing.
Using the Indicator
Attach the Market Behavior Analyzer to a chart and adjust the swing and visual settings as required. The detected market structure, swing classifications, and move measurements are displayed automatically. Click any marked swing point to open the Swing Inspector and examine its individual metrics, while the Market Story panel provides a broader view of the developing structure.
The example below demonstrates the indicator in use and shows how to interact with the displayed swing structure.
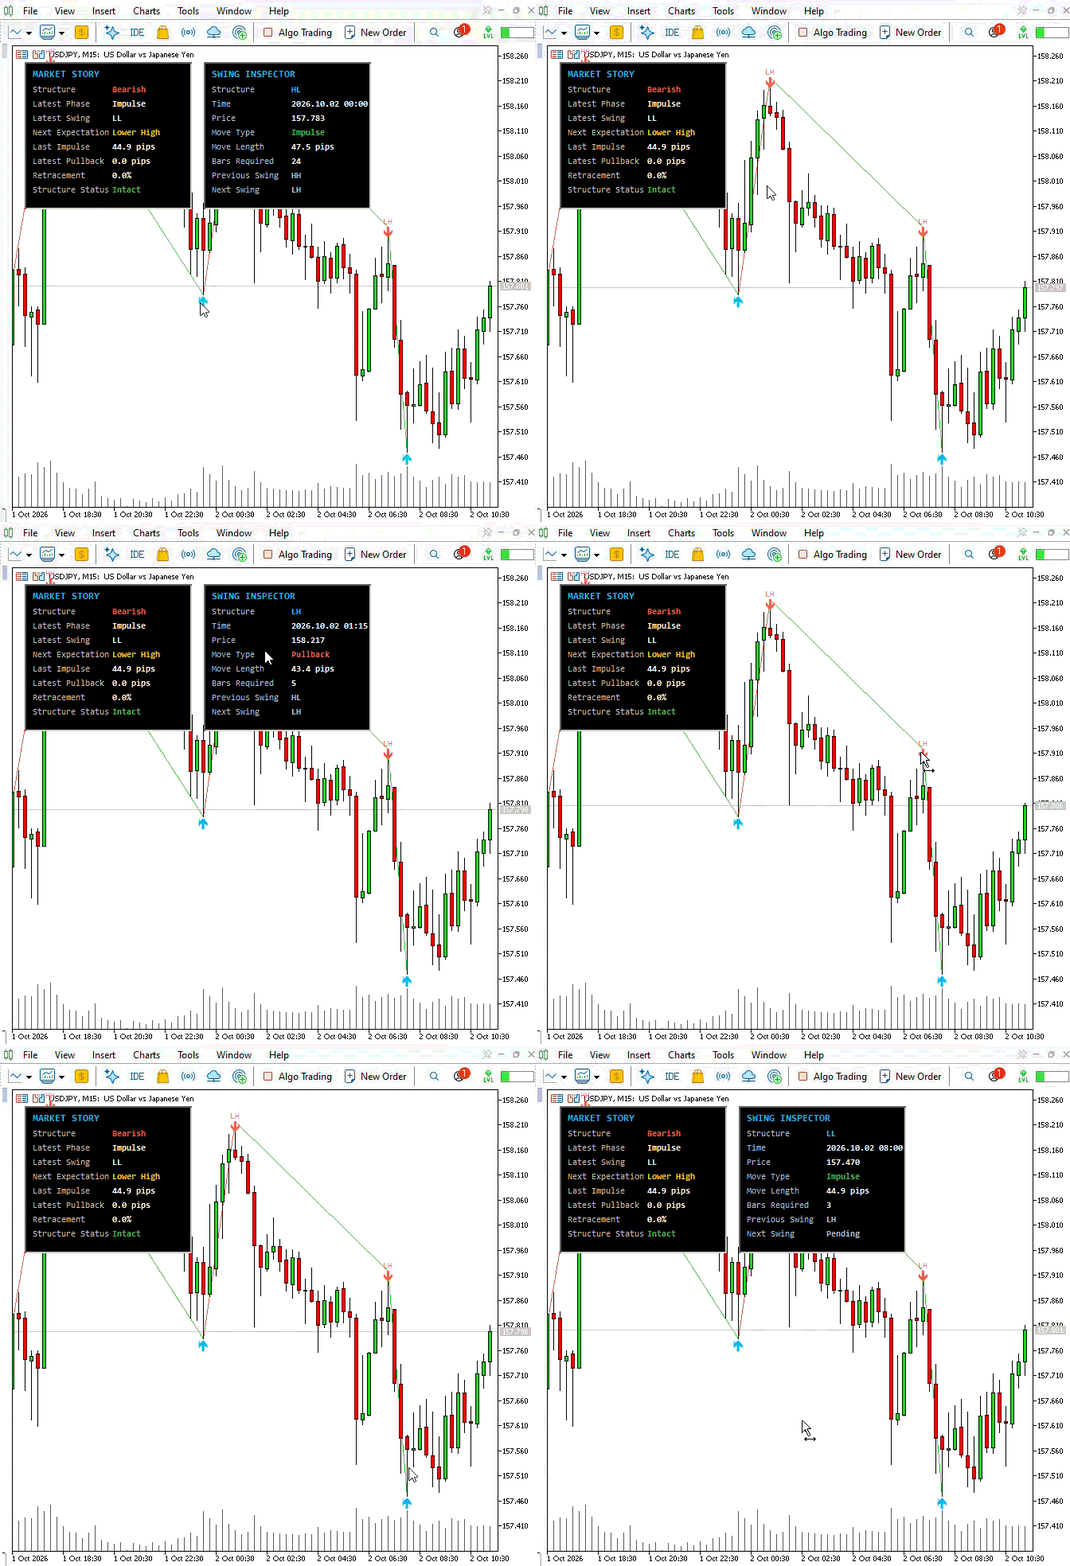
Fig. 1. Market Behavior Analyzer in use on the chart
Further Reading
This Codebase version provides the complete working indicator and a quick introduction to its main features. For a more detailed discussion of the design, market-structure logic, implementation decisions, limitations, and areas that can be improved or extended, refer to this article, Building a market behavior analyzer.
 History Integrity Auditor
Audits the bar history your terminal actually holds, which is the history every backtest and every indicator reads. Six checks per symbol: impossible OHLC values, broken bar times, bars missing while the broker's own session table says it was quoting, empty and flat bars, bars that disagree with the broker's own M1 series, and spread sanity. The headline figure is session coverage, not a grid percentage that mostly measures how many weekends you audited. Every finding goes to CSV with its bar time, and the audited bars plus the session table can be dumped so the whole report can be recounted by something other than this tool.
Stochastic Daily Breakout for Gold, +245 Percent in a 2021-2026 Backtest
Gold EA that trades both directions: when the stochastic signal line turns, it places a stop order at yesterday's high or low, filtered by a Bollinger band. Self-contained, no custom indicators. Backtest on XAUUSD H1, July 2021 to September 2026: +245% on a 1,000 USD deposit at a fixed 0.01 lot, 23.9% maximum equity drawdown.
Accelerator Oscillator (AC)
The Acceleration/Deceleration Indicator (AC) measures acceleration and deceleration of the current driving force.
MACD Signals
Indicator edition for new platform.