 MetaTrader 5
 Experts
 Indicators
 Scripts
 Libraries
 Storage
Join our fan page

History Integrity Auditor - expert for MetaTrader 5

- Views:
- 78
- Rating:
- Published:
-
 You are missing trading opportunities:
- Free trading apps
- Over 8,000 signals for copying
- Economic news for exploring financial markets
Registration Log inYou agree to website policy and terms of use
If you do not have an account, please register -
 Need a robot or indicator based on this code? Order it on Freelance
Go to Freelance
Need a robot or indicator based on this code? Order it on Freelance
Go to Freelance
Every backtest, every indicator and every optimisation result rests on the bar history the terminal happens to hold, and almost nobody audits that history. This tool does: it reads the bars your terminal would hand to an Expert Advisor and counts six classes of defect in them — impossible OHLC values, broken bar times, bars that are missing while the broker says it was quoting, bars with no ticks or no range at all, bars that disagree with the broker's own M1 series, and spreads that are zero or above a limit you set.

Five Market Watch symbols, M15, 5 000 closed bars each; the pass takes about a second. Sess% is the column to read - 99.80 for XAUUSD against 100.00 for the other four - while Grid% ranges over 68-100 and says mostly how much weekend each symbol has. This is the same audit as the journal block further down, repeated two minutes later on a second chart for the screenshot, which is why the file prefix differs; every number is identical. The findings file was switched off for it, and csv rows counts the rows of that file, which is why it reads 0 next to 85 findings. The shipped panel is light text on a dark plate and was recoloured black-on-white here.
The problem
A missing bar is invisible. Candles sit side by side on the chart whether the time between them is one period or three hours, so a hole in the history looks exactly like a quiet market. The Strategy Tester does not warn about it either: it models what it is given, and a strategy tested across a hole is tested on a market that skipped the hour it would have lost money in.
The defects that matter are not exotic. A bar whose close sits above its own high makes a stop-loss test pass that reality would have failed. A duplicated bar time makes every "bars back" calculation point at the wrong bar. A zero-tick bar is a price the market never quoted. A timeframe whose bars do not match the broker's own M1 bars means two of your indicators are reading two different pasts.
The usual test for all of this is to scroll the chart and see whether anything looks odd. That test finds nothing, and it finds nothing in a convincing way.
What it measures
Six independent checks over the last N closed bars of one timeframe, for one symbol, a list, or everything in Market Watch. Each check has a definition that can be recomputed by hand, and each finding is written to a CSV with the bar time, so the report can be audited rather than believed.
- OHLC consistency. high < low, open or close outside [low, high], or any of the four prices at or below zero. One finding per bar per violated predicate: an inverted bar legitimately produces several, because open and close are then both above the high and below the low at the same time.
- Bar times. A time that does not increase from one bar to the next (a duplicate or a bar out of order), and a bar whose open time is not on the period grid — time % PeriodSeconds() != 0 — which is how a history built by a bad import or a broken server session shows itself.
- Missing bars, against the symbol's own sessions. For each pair of consecutive bars the tool computes how many openings of the grid are absent between them. Then, and this is the part that makes the number usable, it asks SymbolInfoSessionQuote whether the market was supposed to be quoting at each missing opening. Missing openings outside every quote session are *explained* (nights, weekends, holidays in the session table); missing openings inside a session are unexplained and counted separately. A symbol with no session record at all is reported as unclassified — never silently as explained. Neither that case nor an empty M1 window occurred on the broker measured below; they are handled, not demonstrated.
- Empty and flat bars. tick_volume == 0 is a bar built from no ticks. open == high == low == close with ticks in it is a flat bar: legal in a dead hour, suspicious in a liquid one, and worth knowing about before an indicator divides by the bar range.
- M1 cross-check. Each audited bar is rebuilt from the M1 bars inside its own window — first open, highest high, lowest low, last close, summed tick volume — and compared with the bar the broker serves for the higher timeframe. Only windows that the M1 history actually covers are compared; windows beyond the M1 coverage are reported as out of coverage and windows inside the coverage with no M1 bar at all get their own counter. Deviations are measured in points, with an optional tolerance.
- Spread sanity. The number of bars whose stored spread is zero, the number above a limit you set, and the maximum and mean spread over the audited bars. A history full of zero spreads is a history that cannot answer any cost question.
The headline figure is session coverage: the share of the openings the broker's own session table says should exist that actually have a bar. Grid coverage — the same ratio over every slot including nights and weekends — is printed next to it, because on its own it tells you mostly how many weekends you audited.
Measured example
Five symbols of the Market Watch of one Exness demo terminal (build 6230), M15, the last 5 000 closed bars of each, audited in about a second on 2026.10.02 at 08:07 server time.
| symbol | bars | span, days | gaps | missing openings | missing in session | OHLC | time defects | empty / flat | M1 compared / mismatched / max dev | grid cov. | session cov. |
|---|---|---|---|---|---|---|---|---|---|---|---|
| XAUUSD | 5 000 | 76.5 | 55 | 2 342 | 10 | 0 | 0 | 0 / 0 | 5 000 / 0 / 0.0000 pts | 68.10 % | 99.80 % |
| EURUSD | 5 000 | 72.1 | 10 | 1 920 | 0 | 0 | 0 | 0 / 0 | 5 000 / 0 / 0.0000 pts | 72.25 % | 100.00 % |
| BTCUSD | 5 000 | 52.1 | 0 | 0 | 0 | 0 | 0 | 0 / 0 | 5 000 / 0 / 0.0000 pts | 100.00 % | 100.00 % |
| GBPUSD | 5 000 | 72.1 | 10 | 1 920 | 0 | 0 | 0 | 0 / 0 | 5 000 / 0 / 0.0000 pts | 72.25 % | 100.00 % |
| USDJPY | 5 000 | 72.1 | 10 | 1 920 | 0 | 0 | 0 | 0 / 0 | 5 000 / 0 / 0.0000 pts | 72.25 % | 100.00 % |
Read the two coverage columns against each other, because that is the whole argument for splitting them. Grid coverage says 68-72 % for every forex symbol and 100 % for BTCUSD, which measures nothing except that forex closes at the weekend and crypto does not. Session coverage - the same ratio over only the openings the broker's own session table claims - says 100.00 % four times and 99.80 % for XAUUSD. One number in that pair of columns is a defect; the rest is the calendar.
That 0.20 % is a single gap, and it is small enough to check by hand. The findings file holds one row for it:
symbol;period;check;bar_index;bar_time;field;detail;value XAUUSD;M15;C3_GAP;3304;2026.09.07 18:30:00;gap;class=unexplained in_session=10;14
In a C3_GAP row, bar_time is the first opening that is missing and bar_index is the index, counted from zero at the oldest audited bar, of the bar that follows the hole, so this row reads: on Monday 2026.09.07 the bar that opened 18:15 is followed by the bar that opened 22:00, and the fourteen openings from 18:30 to 21:45 are absent. Gold's quote sessions for a Monday, as this broker declares them, are 00:00-20:58 and 22:00-24:00. Ten of the missing openings, 18:30 to 20:45, fall inside the first session; the remaining four, 21:00 to 21:45, fall in the declared break. Ten unexplained, four explained, which is what the row says. Two and a half hours of a liquid Monday evening that every backtest on this terminal silently skips, and on the chart it is two candles standing side by side.
The other 2 332 missing XAUUSD openings are the calendar: eleven weekends of 196 openings each, 43 daily breaks of four, and the four break openings inside that Monday hole - 2 156 + 172 + 4. The 1 920 of each forex pair are ten weekends, and nothing else: 10 x 192 openings of 15 minutes is exactly 1 920. Those are the numbers that make grid coverage useless, and they are still worth printing, because a symbol whose "explained" openings do not line up with its session table is telling you the session table is wrong.
The rest of the audit found nothing, which is also a result: across 25 000 bars there was no impossible OHLC value, no duplicated or off-grid bar time, no empty and no flat bar, and all 25 000 bars matched the broker's own M1 series to the last digit - 0.0000 points of maximum deviation. BTCUSD deserves one more line: zero gaps over 52 days, and a spread that is exactly 700 points on all 5 000 bars. A fixed spread is not a defect, but it is not a measurement either, and a strategy tuned on it is tuned on a constant.
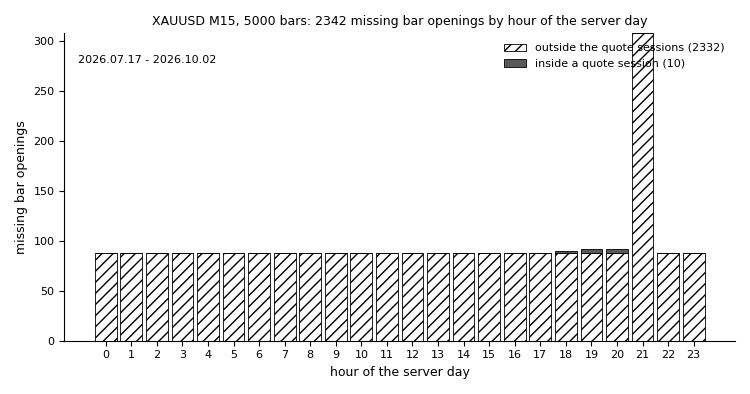
XAUUSD M15, 5 000 bars: every missing bar opening by the hour of the server day, split by what the broker's own session table says about that hour. The hatched bars are the openings outside the quote sessions - eleven weekends, which is why they cover every hour, plus the daily break at 21:00. The ten solid ones are the only openings in 25 000 bars the session table cannot explain, all on one Monday evening. Drawn from the bar dump and the session dump of this run; the tool itself writes the numbers, not the figure.
The same five symbols on M1, with the spread limit set to 20 points, is the opposite kind of page and is worth one paragraph because it shows what the checks look like when they do fire: 10 613 findings, flat bars 20 / 22 / 40 on EURUSD / GBPUSD / USDJPY, a spread above 20 points on all 5 000 gold and BTCUSD bars, and 25 / 28 / 20 missing openings inside a session on the three pairs that had none on M15. The last figure is not a contradiction: 5 000 M1 bars span three and a half days of one week, a different window entirely, and a one-minute hole inside a session is far more common than a fifteen-minute one. On M1 the two coverage columns also converge - 99.44 and 99.44 for GBPUSD - because a window that short contains no weekend for the grid figure to be flattered by.
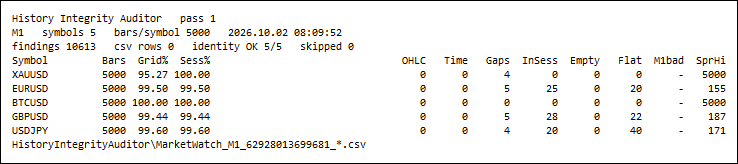
The same tool on M1 with the spread limit at 20 points: Flat and SprHi now carry numbers, InSess finds holes on pairs that were clean on M15, and the M1bad column prints - because on M1 there is nothing below the audited period, so the cross-check reports itself as off - the result table never shows a zero for something it did not measure.
Verifying the report independently
The counters above are checked by something that shares no code with the tool. A Python script reads only the raw material - the bar dump and the session dump the EA writes - recomputes every counter of the OHLC, time, gap, empty/flat and spread checks from the definitions above, and compares the result with the EA's own summary file.
Over the runs behind this article - 15 symbol/period audits across M1, M15 and W1 - it compared 215 counters and reported 0 mismatches, including the ten in-session openings of the gap above, recounted from the bar times and the session table alone.
Two things that recount does not cover. The M1 cross-check is not in those 215 counters: the script can pull the M1 series out of the terminal itself and rebuild the bars, but that path was not run for the numbers here, so compared 5000 / mismatched 0 rests on the EA's own count. And a counter that is zero on both sides is confirmed only as a zero - across every run there was no impossible OHLC value, no non-increasing or off-grid time, no gap that was not a whole number of periods, no empty bar, no M1 mismatch, no window inside the M1 coverage without an M1 bar in it, and no deviation for the tolerance to swallow. Those branches were never seen firing on the data measured here.
What pins the definitions of the defects this broker never produces is a second, smaller test of the recount script itself: a 12-bar synthetic history with the defects written in by hand and the expected counts written beside them - 29 assertions, no terminal involved. The EA applies the same predicates in the same order, and that it does is a reading of the two sources side by side rather than a measurement. The fixture is still where two of the decisions in this tool come from: that an inverted bar must produce five findings rather than one, because with the interval turned inside out the open and the close are each both above the high and below the low; and that a single undivided coverage figure was close to meaningless.
The tool also audits its own arithmetic and prints both sides of each identity, so the report can be checked without any Python at all:
audit 1        : bars 25000 + missing 8102 = 33102, expected_openings 33102 -> OK
audit 1        : expected_openings 33102, grid openings in the audited spans 33102 -> OK (5 symbols OK, 0 not)
audit 2        : C1 0 + C2 0 + C3 85 + C4 0 + C5 0 + C6 0 = 85, findings total 85 -> OK
audit 2        : findings handed to the report 85, rows in the findings file 85, dropped by the guard 0 -> OK
Inputs
| Input | Default | What it does |
|---|---|---|
| Symbols: empty = chart symbol, * = Market Watch, else a list separated by , or ; | empty | A symbol the terminal does not know is skipped with one journal line at normal level and gets no counter row at all, so a recount can never pair a bar dump with a row that measured nothing. |
| Timeframe to audit (0 = current chart period) | Current | Any timeframe from the list. The grid check switches itself off from D1 upwards, where openings are not on a fixed second grid, and the gap check switches itself off on MN1, where the distance between two openings is not a constant. |
| Bars to audit per symbol (closed bars, newest first) | 5000 | Closed bars only. The forming bar changes by definition and would be reported as a defect of the market rather than of the history. |
| C1: check OHLC consistency | true | high < low, open or close outside the bar's own range, any of the four prices at or below zero. One finding per bar per violated predicate. |
| C2: check bar open times (order, duplicates, grid) | true | A time that does not increase from one bar to the next, and an opening that is not a multiple of the period. |
| C3: check missing bars against the quote sessions | true | The check that produces the headline figure. It needs the symbol's session table; without one, gaps are reported as unclassified rather than as explained. |
| C4: count empty (no ticks) and flat bars | true | tick_volume == 0, and open == high == low == close with ticks in it. |
| C5: rebuild each bar from M1 and compare | true | The expensive check, and worth a warning: on M15 over 5 000 bars it costs about a second for five symbols, but on W1 over a 55-year history it needs one M1 request per four bars and took over seven minutes for four symbols, almost all of it inside the terminal's own history requests. Switch it off for a first pass over a long history. |
| C5: ignore deviations up to this many points | 0.0 | A tolerance for a broker whose higher timeframes are built with rounding. 0 reports every difference. |
| C6: flag bars with spread above this (0 = off) | 0 | Counts the bars above the limit. The zero-spread count, the maximum and the mean spread are reported whether or not a limit is set. |
| Journal: example findings printed per check | 5 | How many real rows of each check are printed in full, so the journal shows the defects themselves and not only their number. |
| Write one CSV row per finding | true | The findings file: one row per defect with the bar time, so the report can be audited instead of believed. |
| Also dump every audited bar (for an independent recount) | false | Writes the bars exactly as the terminal served them, plus the session table, which is what makes an independent recount possible. Switching it off deletes the dump of an earlier run, with one journal line per file: a 5 000-bar dump sitting next to a 500-bar counter row is exactly the silent wrong number this tool exists to catch. |
| Draw the result table on the chart | true | In a non-visual tester it switches itself off with a journal line instead of failing. |
| Panel corner | Left upper | Anchor corner of the table. |
| Panel font size | 8 | The table is wider than a single chart label can show, so it is drawn as several label columns; lower the size on a small chart. |
| Panel X offset, px | 10 | Position. |
| Panel Y offset, px | 18 | Position. |
| Re-audit every N minutes (0 = audit once) | 0 | For leaving it on a chart. It uses the terminal's own clock, so the same setting behaves in the Strategy Tester. |
The report
Everything the tool measured goes to the journal as one block, and the same numbers go to CSV. Below is that block for the run in the table above, verbatim, with the per-symbol part shown for XAUUSD only — the other four symbols repeat the same ten lines.
=== History Integrity Auditor ============================================ symbols : 5 (Market Watch) period : M15 bars per symbol: 5000 (closed bars, newest first) checks : C1 on C2 on C3 on C4 on C5 on C6 limit 0 points C5 tolerance : 0.00 points journal examples per check: 5 refresh : once file prefix : HistoryIntegrityAuditor\MarketWatch_M15_62879570657522_*.csv symbol 1 of 5 : XAUUSD symbol 2 of 5 : EURUSD symbol 3 of 5 : BTCUSD symbol 4 of 5 : GBPUSD symbol 5 of 5 : USDJPY =================================================================== HistoryIntegrityAuditor: pass 1 starts on 5 symbol(s), M15, server time 2026.10.02 08:07:11 HistoryIntegrityAuditor: C3_GAP example 1 of 5: XAUUSD M15 bar 2026.07.17 21:00:00 gap class=explained in_session=0 196 [... examples 2 to 5 of the same check ...] === History Integrity Auditor - result of pass 1 ======== Symbol Bars Grid% Sess% OHLC Time Gaps InSess Empty Flat M1bad SprHi XAUUSD 5000 68.10 99.80 0 0 55 10 0 0 0 - EURUSD 5000 72.25 100.00 0 0 10 0 0 0 0 - BTCUSD 5000 100.00 100.00 0 0 0 0 0 0 0 - GBPUSD 5000 72.25 100.00 0 0 10 0 0 0 0 - USDJPY 5000 72.25 100.00 0 0 10 0 0 0 0 - XAUUSD M15: 5000 bars from 2026.07.17 20:30:00 to 2026.10.02 07:45:00, 76.47 days, 10 sessions, point 0.001, 0 opening(s) behind the server time XAUUSD M15: quote sessions Sun 22:01-24:00 | Mon 00:00-20:58, 22:00-24:00 | Tue 00:00-20:58, 22:00-24:00 | Wed 00:00-20:58, 22:00-24:00 | Thu 00:00-20:58, 22:00-24:00 | Fri 00:00-20:58 XAUUSD M15: grid openings 7342 = bars 5000 + missing 2342, identity OK, grid coverage 68.10%, session coverage 99.80% XAUUSD M15: C1 on, total 0 (high<low 0, open>high 0, open<low 0, close>high 0, close<low 0, non positive 0) XAUUSD M15: C2 on, total 0 (not increasing 0, off grid 0), steps that are not a whole number of periods 0 XAUUSD M15: C3 on, gaps 55 (explained 54, unexplained 1, unclassified 0), missing 2342, in session 10, unclassified 0, largest gap 196 slots after 2026.07.17 20:45:00 XAUUSD M15: C4 on, empty 0, flat 0 XAUUSD M15: C5 on, M1 coverage 2026.06.23 03:04:00 to 2026.10.02 08:07:00, compared 5000, mismatched 0, window empty 0, out of coverage 0, max deviation 0.0000 points XAUUSD M15: C6 limit off, spread zero 0, above limit -, max 238 points, mean 175.1568 points XAUUSD M15: findings of this symbol 55 [... the same ten lines for EURUSD, BTCUSD, GBPUSD and USDJPY ...] symbols : 5 audited, 0 skipped totals : bars 25000, missing 8102, in session 10, findings 85 audit 1 : bars 25000 + missing 8102 = 33102, expected_openings 33102 -> OK audit 1 : expected_openings 33102, grid openings in the audited spans 33102 -> OK (5 symbols OK, 0 not) audit 2 : C1 0 + C2 0 + C3 85 + C4 0 + C5 0 + C6 0 = 85, findings total 85 -> OK audit 2 : findings handed to the report 85, rows in the findings file 85, dropped by the guard 0 -> OK file overview : HistoryIntegrityAuditor\MarketWatch_M15_62879570657522_overview.csv (5 rows) file findings : HistoryIntegrityAuditor\MarketWatch_M15_62879570657522_findings.csv (85 rows) files summary : 5 file(s), 5 row(s); sessions 5 file(s), 35 row(s); bars 5 file(s), 25000 row(s) file pattern : HistoryIntegrityAuditor\MarketWatch_M15_62879570657522_<symbol>_{summary,sessions,bars}.csv panel : 1452 x 294 pixels, 16 labels, widest line 119 characters ===================================================================
Note SprHi - in the table and above limit - in the C6 line. The spread limit was 0, which means the check is off, so the column prints a dash and not a zero. The tool applies that rule to every column of the result table and every figure of the per-symbol lines: a check that did not run prints -, a check that ran and found nothing prints 0, and the two are never the same character. It matters more than it looks — with the gap check off, a coverage figure computed as bars / (bars + missing) would read a confident 100.00 %.
Five files come out of a run, in MQL5\Files\HistoryIntegrityAuditor\:
- <prefix>_overview.csv — one row per symbol of the list, including the symbols that could not be audited, with their status.
- <prefix>_findings.csv — one row per defect: symbol;period;check;bar_index;bar_time;field;detail;value.
- <prefix>_<symbol>_summary.csv — every counter of one symbol, 62 columns, including the arithmetic identity.
- <prefix>_<symbol>_sessions.csv — the symbol's quote sessions as the broker declares them, which is the input that decides whether a gap is explained.
- <prefix>_<symbol>_bars.csv — optional, the audited bars exactly as the terminal served them.
The last two are what make the report checkable by something other than this tool, which is the subject of the section above. The prefix carries the symbol tag, the timeframe and the chart id, so two charts cannot overwrite each other's evidence, and a tester run writes into the agent's own sandbox rather than over a live run's files.
How to use it
- Attach it to a chart of the symbol and timeframe you actually test on, set the number of bars to at least the range your backtests use, and read the journal.
- Start with session coverage and missing in session. Those two numbers decide whether your backtests ran on the market or on a sketch of it.
- Sort the C3_GAP rows of the findings file by the hour in bar_time. Holes concentrated at one hour of the day are usually a server or a session problem; holes spread evenly are usually an incomplete download.
- Press Refresh in the terminal's Symbols dialog (or delete the history and let it re-download) and run the audit again. The difference between the two runs is what your terminal was missing locally rather than what the broker lacks.
- Switch the M1 cross-check on for the timeframe your EA trades. A mismatch that is still there after a history refresh is worth a question to the broker: it means two of its own series disagree.
- Re-run it after changing broker, server, or anything about how history is fetched. Data quality is a property of a particular terminal at a particular time, not of a symbol.
Limits, stated plainly
- It audits the history your terminal holds, which is the history your tests use — not whatever the broker's server could still send. Refreshing the history can change every number here, and step 4 above exists for exactly that reason.
- A gap the session table calls explained can still be a real hole, because the session table is also the broker's statement. The tool shows both figures so the two claims can be compared instead of blended.
- The M1 cross-check can only speak where the M1 history reaches. It is silent, by design, about older bars, and the count of windows it skipped is printed next to the count it compared.
- Tick data is not audited. Real-tick backtests have a second data set with its own defects, and this tool does not look at it.
- It reports; it does not repair. Nothing here writes to the history, and no finding on its own proves the broker is at fault — a terminal that was offline for an hour produces the same missing bars as a feed that stopped.
- No trading functions, no DLL, no network access, no external files: it reads bars and writes CSV files to MQL5\Files.
Stochastic Daily Breakout for Gold, +245 Percent in a 2021-2026 Backtest
Gold EA that trades both directions: when the stochastic signal line turns, it places a stop order at yesterday's high or low, filtered by a Bollinger band. Self-contained, no custom indicators. Backtest on XAUUSD H1, July 2021 to September 2026: +245% on a 1,000 USD deposit at a fixed 0.01 lot, 23.9% maximum equity drawdown.
 Prop Firm Risk Calculator - Position Size and Loss Limits
Calculates position size and daily / max loss limits for prop firm accounts and shows them in a panel on the chart.
Market Behavior Analyzer: Swing Structure and Market Context
The Market Behavior Analyzer is a practical indicator designed to make market structure easier to read directly from the chart. It identifies significant swing points, classifies them as Higher Highs, Higher Lows, Lower Highs, and Lower Lows, and tracks the movement between them in pips. It also provides a Market Story panel and an interactive Swing Inspector for examining impulses, pullbacks, retracements, swing duration, and the developing market structure.
MACD Signals
Indicator edition for new platform.