 MetaTrader 5
 Experts
 Indicators
 Scripts
 Libraries
 Storage
Join our fan page

Edge or Luck: bootstrap test of your average trade - script for MetaTrader 5

- Views:
- 63
- Rating:
- Published:
-
 You are missing trading opportunities:
- Free trading apps
- Over 8,000 signals for copying
- Economic news for exploring financial markets
Registration Log inYou agree to website policy and terms of use
If you do not have an account, please register -
 Need a robot or indicator based on this code? Order it on Freelance
Go to Freelance
Need a robot or indicator based on this code? Order it on Freelance
Go to Freelance


Edge or Luck reads the closed trades in your account history and checks whether your average trade is large enough to tell apart from luck. A net profit or a profit factor tells you what happened, but not how easily the same numbers could have come from chance. With only a few dozen trades, chance can explain a lot, and this script estimates how much from your own trades.
It uses a bootstrap, the resampling method Bradley Efron introduced in 1979. The script draws as many trades as you have from your own history, at random and with replacement, so some trades appear twice and some not at all, and works out their average. It repeats this 10,000 times. The middle 95% of those averages is the range your true average trade most likely sits in, and the share of averages below zero is the chance that the true average is below zero. The method makes no assumption about the shape of your returns, which suits trading, where a few large trades often carry the whole result.

The script on a USD/JPY chart, reading a demo account with 44 closed trades: the whole range is above zero.
How to read the result
- The whole range is above zero: on this sample the edge looks real.
- The range includes zero: the result could still be luck.
- The whole range is below zero: the losses are larger than luck explains.
- Fewer than 30 trades (you can change the number): the script says the sample is too small to judge. With very few trades the bootstrap can only reshuffle the trades you already have, so it never sees the losses that haven't happened yet, and the range comes out too narrow.
The result is printed in the Experts tab of the Toolbox and shown in the top left corner of the chart. The chart you run it on does not matter, because the script reads the whole account history rather than the chart's symbol. Run it again with other settings to replace the text, for example to check one Expert Advisor or only the last 30 days.
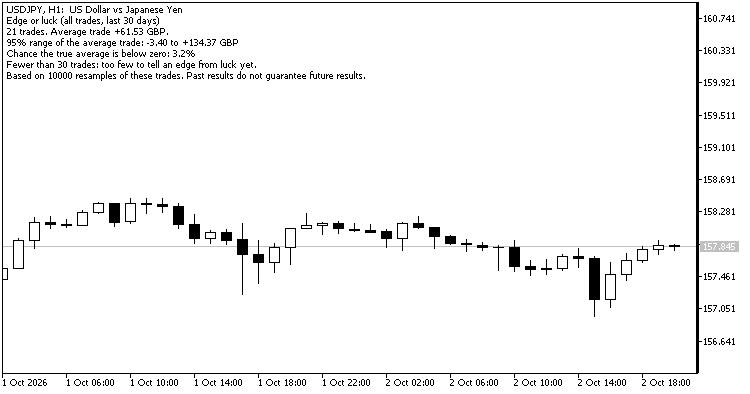
The same account, last 30 days only: 21 trades, so the script does not give a verdict yet.
How trades are counted
A trade is every deal of one position, counted once the position is closed. Its net result is profit plus commission, fee and swap, as recorded in your broker's deal history, so it matches what you were charged. Deposits, withdrawals and charges booked outside trades are left out, and so are positions that are still open. On a netting account, a position that is reversed counts as one trade.
Parameters
- Magic number: -1 for all trades, 0 for manual trades only, or the magic number of one Expert Advisor.
- Symbol: leave empty for all symbols.
- Only trades closed in the last N days: 0 for the whole history.
- Resamples: 1,000 to 100,000 (default 10,000).
- Fewest trades for a verdict: default 30.
Notes
- The script only reads the history. It never opens, changes or closes a trade, so you can run it next to live Expert Advisors.
- The random numbers start from a fixed seed, so running the script twice on the same history gives the same answer.
- The test describes trades that already happened. It cannot tell you whether the market will keep behaving the same way, and past results do not guarantee future results.
- YuRaLytics Trade Analyzer, free in the Market, runs the same test for every Expert Advisor and symbol at once in a chart panel. It also checks drawdowns and losing streaks and shows what commission and swap cost you.
 Prop Firm Daily Loss Tracker - Daily Loss Limit Monitor
Shows the day's result against the daily and max loss limits of a prop firm account, with a warning alert, in a panel on the chart.
Market Behavior Analyzer: Swing Structure and Market Context
The Market Behavior Analyzer is a practical indicator designed to make market structure easier to read directly from the chart. It identifies significant swing points, classifies them as Higher Highs, Higher Lows, Lower Highs, and Lower Lows, and tracks the movement between them in pips. It also provides a Market Story panel and an interactive Swing Inspector for examining impulses, pullbacks, retracements, swing duration, and the developing market structure.
Accelerator Oscillator (AC)
The Acceleration/Deceleration Indicator (AC) measures acceleration and deceleration of the current driving force.
MACD Signals
Indicator edition for new platform.