 MetaTrader 5
 Experts
 Indicators
 Scripts
 Libraries
 Storage
Join our fan page

Portfolio Correlation Analyzer - script for MetaTrader 5

- Views:
- 1159
- Rating:
- Published:
- Updated:
-
 You are missing trading opportunities:
- Free trading apps
- Over 8,000 signals for copying
- Economic news for exploring financial markets
Registration Log inYou agree to website policy and terms of use
If you do not have an account, please register -
 Need a robot or indicator based on this code? Order it on Freelance
Go to Freelance
Need a robot or indicator based on this code? Order it on Freelance
Go to Freelance
The idea
If you run several EAs on one account, the number that matters is not how much each one earns. It is how much of their combined risk cancels out.
Measure the worst losing stretch of each system on its own and add those numbers together. Then measure the worst losing stretch of the whole account over the same period. The second number is always smaller. How much smaller is the only honest measure of your diversification, and no terminal report shows it.
This script measures it. It reads your closed trade history, groups it by magic number, and reports four things.
What it reports
1. Per system. Trade count, net result and maximum drawdown for every magic number that passes the minimum trade filter.
2. Compression. The sum of all standalone drawdowns against the drawdown of the combined account, and the ratio between them. A ratio near 1 means the systems fall together and you own one strategy several times. A high ratio means their bad periods land on different dates.
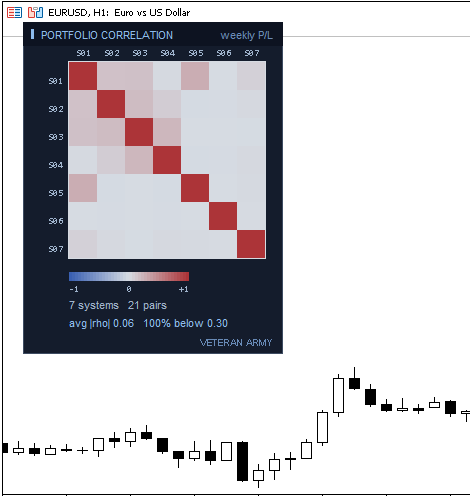
3. Correlation. The full pairwise Pearson correlation matrix on period profit and loss, the average absolute rho, the share of pairs below 0.30, and the most correlated pair by name. The same matrix is drawn on the chart as a heat map: pale means the two systems ignore each other, red means they win and lose together, blue means they are opposites.
4. Monte Carlo. The same period results, reshuffled into a new random order a few thousand times. History gave you one ordering of months. The market was free to deliver the same months in any other order, and the worst stretch changes when it does. The script reports the drawdown at the 50th, 90th and 95th percentile of that cloud, and tells you where your single historical path sits inside it. Most backtests land in the friendly half.
Everything is also written to CSV, so the matrix can be heat mapped in a spreadsheet.
How to read the output
The compression ratio is the headline. Two, three, ten times: that is what diversification bought you, in your own currency, on your own trades.
The average absolute rho tells you whether the roster is genuinely different or only looks different. Values under 0.15 across many pairs are a real portfolio. Values above 0.40 mean you are running variations of one idea.
The Monte Carlo percentile is the uncomfortable one. If your historical drawdown sits at the 60th percentile of the cloud, then two thirds of the alternative histories were kinder to you than the one that happened. Plan position size from the tail of the cloud, not from the single path.
Inputs
- InpGrain - bucketing granularity for the profit and loss series: monthly, weekly or daily. Monthly is the default and the safest: correlations computed on sparse daily buckets are pulled toward zero by the empty cells. The script warns you when the chosen granularity leaves too many empty buckets.
- InpMCRuns - number of Monte Carlo reshuffles. Default 2000. Values below 100 or above 100000 are clamped.
- InpMinTrades - magic numbers with fewer closed trades than this are left out of the report, and out of the combined portfolio as well, so the comparison stays like for like. Default 20.
- InpRefBalance - reference balance used only to express the Monte Carlo drawdown as a percentage. Default 10000.
- InpExportCSV - write the period profit and loss table and the correlation matrix to MQL5\Files. File names are prefixed PCA_ so they never overwrite another tool's export.
- InpDrawPanel - draw the heat map on the chart. When false, any panel left by an earlier run is removed.
- InpMaskMagics - label the systems S01, S02 and so on instead of printing the real magic numbers. Useful for screenshots.
- InpPanelX, InpPanelY - panel offset from the top left corner, in pixels.
- InpPanelMaxPx - maximum side of the heat map grid. Cell size adapts to the number of systems; small portfolios get larger cells.
- InpPanelMaxSys - above this many systems the panel is skipped, because the grid would need more rectangles than the chart can redraw comfortably. The CSV export still contains the full matrix. Default 64.
- InpMCSeed - 0 draws a random seed, any other value makes the Monte Carlo percentiles repeatable. Use a fixed seed when the figure goes into a report.
Notes and limits
Drawdowns are computed on closed trade results at the chosen granularity. They do not include the floating excursion of open positions, which is deeper, often by a third or more on multi symbol systems. Read the numbers as realised drawdown, and remember that your equity drawdown was worse.
Both entry and exit deals are counted. Most brokers charge commission on the entry as well, and counting only exit deals silently understates cost.
Magic number 0 is included if it passes the trade filter, and the script says so in the log. On most terminals that bucket holds manual trades and any EA left on its default magic, so it is not necessarily one system.
Correlation needs enough periods to mean anything. Two systems with six months of overlap will produce a number, but not a reliable one.
The panel objects stay on the chart after the script finishes, which is what you want for a screenshot. Run it again with InpDrawPanel set to false to remove them.
What it does not do
It never places, modifies or closes an order. It does not predict anything, it does not produce signals, and it does not connect to any network or external service. It reads your history and reports what is in it.
Pure MQL5, single file, no external libraries.
 SHK Heikin Ashi MACD Signal Arrows
A MetaTrader 5 chart indicator that draws Heikin Ashi candles, confirmed buy and sell arrows, optional MACD histogram divergence filtering, and configurable alerts.
 GoldLondonBreakout
Locks in the Asian session range on XAUUSD, then places an OCO breakout pair (BuyStop/SellStop) for the London open, with ATR-based stops and risk-percent position sizing. No indicators, no discretion — the range is measured, not guessed.
GoldScalpBot — Autonomous XAUUSD Scalper with Local App Bridge (IC Markets)
What it does DEMO = unlimited free. LIVE = 7-day trial, then rent GoldScalping Pro on MQL5 Market: https://www.mql5.com/en/market/product/190166 Trades XAUUSD on M5 during London / New York sessions Entry logic: EMA momentum + short breakout/retest filters Exits: ATR-based Stop Loss / Take Profit + optional time-stop Risk: fixed % of equity per base trade Lot scaling: increases only after consecutive wins (capped) — no martingale after losses Daily loss stop and max spread filter Optional local HTTP bridge for a companion mobile/web app (monitor, pause, close, modify SL/TP)
SMC Order Block Detector with Alert for MT5
The SMC Order Block Detector indicator features an Advanced Smart Money Concepts (SMC) Order Block (OB) Engine inspired by the TradingHub 3.0 methodology. It is specifically engineered to automatically detect, track, and manage institutional Order Blocks with high precision on MetaTrader 5. A key highlight of this indicator is its Smart Overlap Management: when new Order Blocks form and overlap with existing active zones, the algorithm intelligently evaluates their Fair Value Gap (FVG) sizes. It automatically filters out and deactivates weaker or redundant zones, ensuring that only the highest-probability institutional levels remain on your chart.