 MetaTrader 5
 Experts
 Indicators
 Scripts
 Libraries
 Storage
Join our fan page

EVT Crash Gauge - indicator for MetaTrader 5

- Views:
- 1336
- Rating:
- Published:
- Updated:
-
 You are missing trading opportunities:
- Free trading apps
- Over 8,000 signals for copying
- Economic news for exploring financial markets
Registration Log inYou agree to website policy and terms of use
If you do not have an account, please register -
 Need a robot or indicator based on this code? Order it on Freelance
Go to Freelance
Need a robot or indicator based on this code? Order it on Freelance
Go to Freelance
Overview
Almost every risk tool in the standard MetaTrader 5 toolbox shares one hidden assumption: that the worst loss worth planning for is roughly the worst loss you have already seen. Average True Range sizes positions from recent volatility. A Monte Carlo resampler reshuffles the trades you actually took. Historical Value at Risk reads a percentile straight off your return history. All of them look at the body of the distribution and quietly hope the future produces nothing more extreme than the past.
Financial returns are fat-tailed, so that hope is misplaced. Large moves happen more often and reach further than a normal distribution allows, and the single worst day in a sample is almost never the worst day the market is capable of. Any method that can only see losses as bad as the ones already in its window will systematically understate a rare crash.

The normal model (curve) versus real fat-tailed returns (histogram). The shaded left tail is the loss it misses.
This indicator brings the branch of statistics built for that gap into MQL5 natively. Extreme Value Theory does not model the whole distribution; it models only the tail, and it does so with a shape justified by a limit theorem rather than assumed. The fitted model can then extrapolate beyond anything in the sample: a 99.9% loss, a move seen roughly once every three years, a number your history never actually produced.
The method. The indicator implements Peaks-Over-Threshold. It converts the chart's closes into a one-sided downside-loss series, keeping the magnitude of every down move and mapping every up move to zero. It picks a high threshold u at a quantile of that series, discards everything below it, and studies only the exceedances, the amounts by which losses cross the threshold. The Pickands-Balkema-de Haan theorem states that for a wide class of underlying distributions those excesses converge, as the threshold rises, to a single family: the Generalized Pareto Distribution. So the tail's shape does not have to be guessed, only fitted.

Peaks-Over-Threshold: a threshold is set on the loss series, the exceedances above it are peeled off, and a Generalized Pareto Distribution is fitted to those excesses alone.
The fit is a genuine maximum-likelihood optimisation of the GPD's shape and scale, run through the ALGLIB constrained optimiser shipped with the terminal. There is no Python bridge, no DLL, and no external dependency of any kind.
What It Reports
Three numbers are computed on a rolling window and shown on an on-chart panel, with the first of them also plotted as a line in a sub-window so the tail can be watched tightening and loosening over time.
| Reading | What it is | How to use it |
|---|---|---|
| EVT VaR | Value at Risk at the chosen confidence, extrapolated from the fitted tail rather than read off the history. | The loss you should plan for. Shown as a percentage on the panel and plotted as the sub-window line. A lifting line means the tail is fattening. |
| EVT ES | Expected Shortfall, the average loss given that VaR is breached. | How bad it gets once the bad case happens. Always worse than VaR, and the more honest number for stop placement. |
| xi (shape) | The fitted tail index. Larger means heavier: losses compound further out. | The regime reading, colour coded on the panel. This is the parameter that decides how far the extrapolation reaches. |
The two estimators are the standard GPD-POT forms, so what the panel reports is exactly:
VaR_p = u + (sigma / xi) * [ ( (Nu / n) / (1 - p) )^xi - 1 ]
ES_p  = VaR_p / (1 - xi) + (sigma - xi * u) / (1 - xi)
Here u is the threshold, sigma and xi are the fitted scale and shape, and Nu / n is the exceedance rate. Both have an exponential limit that is used automatically when the fitted shape sits close to zero, which keeps the arithmetic stable in exactly the regime where dividing by the shape would not be.
The tail traffic light. The panel colours the shape so the regime can be read without interpreting a number:
| xi | Colour | Reading |
|---|---|---|
| below 0.10 | Green | Close to the thin-tailed exponential case. Calm. |
| 0.10 to 0.30 | Gold | Moderately heavy, where most liquid instruments live. |
| above 0.30 | Red | Heavy tailed. Losses compound and crashes cluster. |
Those cutoffs are reading aids rather than statistical thresholds, and they can be shifted to taste. What matters is that the same shape driving the colour is the shape driving the formulas, so the panel cannot show green while the arithmetic is quietly computing a fat-tailed VaR.
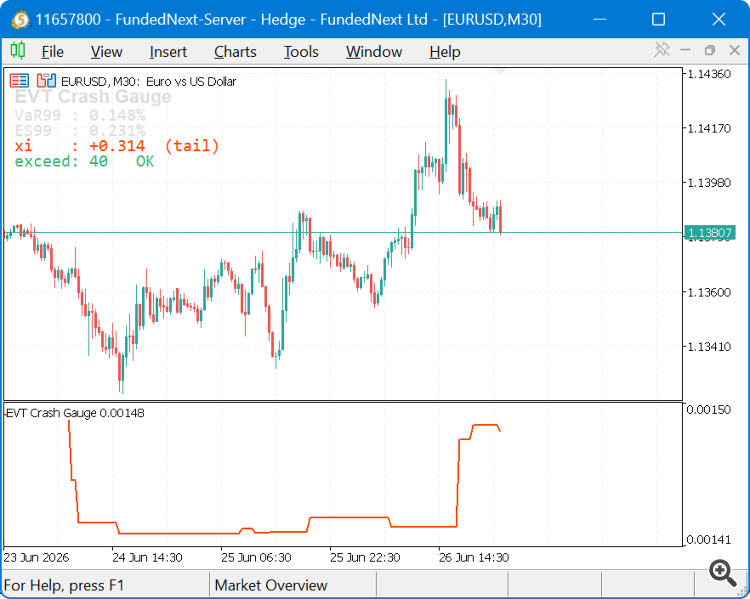
The gauge on a chart: the panel reports VaR, Expected Shortfall, and the colour-coded tail shape, while the sub-window plots the EVT VaR over time.
It Refuses to Guess
This is the design decision worth knowing before you attach it, because it changes what a blank reading means. A two-parameter tail fit needs a real number of exceedances to be trustworthy, and the EVT literature treats roughly thirty to fifty tail points as the practical floor. The engine enforces thirty. Below that it reports its status rather than a figure, and the panel says so in plain words:
| Status | Meaning |
|---|---|
| OK | The fit converged on enough tail data. VaR, ES and xi are live. |
| insufficient tail data (N/30 exceedances) | The window produced fewer than thirty exceedances. Raise the lookback or lower the threshold quantile. |
| fit did not converge | The optimiser did not reach a valid shape and scale. Nothing is reported. |
| not fitted / bad input | No fit has run yet, or the window was empty or degenerate. |
A concrete example of this in action: at the default 0.95 threshold, a 500-bar lookback yields only about twenty-five exceedances, and the gauge reports insufficient tail data (25/30 exceedances) instead of a number. At 800 bars it clears the floor and fits cleanly. That is not a bug to work around, it is the model declining to guess, which is precisely the behaviour you want from a tool whose entire purpose is honesty about rare events.
The same principle applies at the other end. When the fitted shape reaches one the mean of the tail diverges and Expected Shortfall stops existing, so the engine returns zero there rather than a fabricated figure. Wherever a fit does not earn the OK status the plotted line is left blank for that bar rather than carrying a stale value forward, so the line is empty exactly where the model declined to commit.
Recommended Setup
| Setting | Recommended value | Notes |
|---|---|---|
| Symbol | Any liquid instrument | Nothing is symbol specific: the fit runs on log returns, so the readings are percentages and comparable across instruments. A thinly traded symbol is the one case likely to fail the exceedance floor. |
| Timeframe | H4 or D1 | The VaR is a per-bar loss magnitude, so the timeframe sets what the number means. On D1 it is a daily loss. Intraday works but the tail of a one-minute return is a different object. |
| Lookback | 800 bars | Chosen so the 0.95 threshold clears the thirty-exceedance floor with margin. Shorter windows react faster but hit the floor. |
| History required | Lookback + 2 bars | Nothing is drawn before the first fittable bar. Make sure the chart has actually downloaded that much history, or the gauge stays blank. |
| Threshold quantile | 0.95 | The standard default. Lowering it buys exceedances at the cost of asymptotic validity, since the theorem holds as the threshold rises. |
Input Parameters
| Parameter | Default | Description |
|---|---|---|
| Lookback | 800 | Rolling window, in bars, that each fit is computed over. A window whose usable returns fall below half this count is rejected as too sparse. |
| ThresholdQuant | 0.95 | Quantile of the loss series used to place the POT threshold u. Accepted between 0.5 and 0.999. |
| Confidence | 0.99 | Confidence level for VaR and ES. The fitted tail extrapolates, so 0.999 is a legitimate setting even though the sample contains no such loss. |
| RefitEvery | 1 | Refit cadence for historical bars. At 1 every bar is refitted and the plotted line is fully resolved; raising it trades historical resolution for speed on very long charts. The current bar is always refitted regardless. |
| ShowPanel | true | Draw the on-chart text panel. The panel objects are removed when the indicator is detached. |
Using the Engine in Your Own Code
The tail model is a standalone header-only class, CGPDModel, with no dependency on charts or indicator buffers. It fits an array of losses where larger simply means worse, so the sign convention stays the caller's, and any strategy that can produce a loss series can use it directly:
#include <EVT\GPDModel.mqh>

CGPDModel model;
model.SetThresholdQuantile(0.95);

if(model.Fit(losses,count) && model.IsReliable())
  {
   double var = model.VaR(0.99);
   double es  = model.ExpectedShortfall(0.99);
   double xi  = model.Xi();
  }
else
   Print("tail not usable: ",model.StatusText());
Alongside those, the class exposes the fitted scale, the threshold it selected, the exceedance count, and the status enumeration, so a consumer can log or display exactly why a reading was withheld. To read the indicator instead of the class, acquire a handle with iCustom on EVT\EVTCrashGauge and copy buffer 0, which carries the EVT VaR and holds zero on any bar where the fit was not reliable.
Limitations
EVT earns its place in a risk toolkit, but it is a specialised instrument and using it well means knowing where it does not apply:
- It is hungry for tail data. A two-parameter tail fit needs a meaningful number of exceedances. On a thinly traded symbol or a short window the right answer is "insufficient data", and the design honours that rather than inventing a number.
- It is sensitive to the threshold. The 0.95 default is standard, but the fitted shape and scale do shift with it. A serious deployment would study that sensitivity rather than trust one setting, which is why the quantile is exposed as an input.
- It measures magnitude, not timing. Worth repeating because it is the most common misuse. A rising tail index is not a directional signal.
- The tail can stop being well defined. As the fitted shape approaches one, Expected Shortfall ceases to exist, and a zero in that regime is itself information rather than a failure.
File Structure
One indicator and one header. The header is included as <EVT\GPDModel.mqh>, so it must sit in its EVT subfolder under Include.
| File | Role | Description |
|---|---|---|
| Indicators\EVT\EVTCrashGauge.mq5 | The gauge | Builds the downside-loss series from the rolling window of closes, drives the fit on a bar cadence, plots the EVT VaR, and maintains the on-chart panel with its colour-coded tail reading. |
| Include\EVT\GPDModel.mqh | Tail engine | The CGPDModel class: threshold selection, exceedance extraction, maximum-likelihood fit of the GPD by ALGLIB constrained optimisation, VaR and Expected Shortfall, and the status enumeration that gates every reading. |
The engine seeds the optimiser with a method-of-moments estimate before running maximum likelihood, and constrains the shape to a sane box, so a pathological window pushes it toward a rejected fit rather than toward a plausible-looking wrong one.
Research Basis
The implementation follows the standard Peaks-Over-Threshold treatment of Extreme Value Theory: the Pickands-Balkema-de Haan theorem for the convergence of threshold excesses to the Generalized Pareto Distribution, maximum-likelihood estimation of its shape and scale, and the usual GPD-POT expressions for Value at Risk and Expected Shortfall.
A companion article derives the method, walks through the engine and the indicator line by line, and wires the tail estimate into a position-sizing Expert Advisor to measure what it does in the Strategy Tester: Extreme Value Theory in MQL5: Building a Tail-Risk Crash Gauge Beyond Monte Carlo VaR.
Sessionvolatilityheatmap
Shows average price range per hour of the trading day as an on-chart heatmap, plus Asian/London/New York session shading behind the candles — so you can see when a symbol actually moves, not just guess.
Trade Journal and Performance Analytics Dashboard
A lightweight on-chart dashboard that reads your closed trade history and shows win rate, profit factor, streaks, and an equity curve — no strategy inputs, just your own numbers, refreshed automatically.
RSI Histogram
This is an MQL5 custom indicator for MetaTrader 5 called RSI Histogram. It plots the standard RSI line in a separate window, plus a color-coded histogram version of the same RSI values that changes color based on momentum:
 GoldLondonBreakout
Locks in the Asian session range on XAUUSD, then places an OCO breakout pair (BuyStop/SellStop) for the London open, with ATR-based stops and risk-percent position sizing. No indicators, no discretion — the range is measured, not guessed.