 MetaTrader 5
 Experts
 Indicators
 Scripts
 Libraries
 Storage
Join our fan page

Trade Journal and Performance Analytics Dashboard - indicator for MetaTrader 5

- Views:
- 1093
- Rating:
- Published:
- Updated:
-
 You are missing trading opportunities:
- Free trading apps
- Over 8,000 signals for copying
- Economic news for exploring financial markets
Registration Log inYou agree to website policy and terms of use
If you do not have an account, please register -
 Need a robot or indicator based on this code? Order it on Freelance
Go to Freelance
Need a robot or indicator based on this code? Order it on Freelance
Go to Freelance
Trade Analytics Dashboard
The idea behind it
The code is built on a simple idea: your trading account already contains an honest performance report, you just have to read it. Instead of exporting history to a spreadsheet, this indicator queries the terminal's own closed-deal history through HistorySelect() and HistoryDealGetTicket(), aggregates it, and renders the result as a small panel drawn directly on the chart with the CCanvas class. It does not analyze price, and it does not place, modify, or close a single order — it only reads deals you have already made, so it needs no AutoTrading permission.
How to interpret the panel
Each line on the panel answers one specific question about your trading, over whatever lookback window you set:
- Trades (Nd) — how many closed trades fall inside the lookback window. A win rate or profit factor based on a handful of trades is not meaningful yet; treat anything under roughly 30 trades as a preview, not a verdict.
- Win rate — the percentage of closed trades that closed at or above break-even (swap and commission included). On its own it says nothing about whether the system is profitable — a 30% win rate with large winners can still be a strongly profitable system.
- Profit factor — gross profit divided by gross loss. Above 1.0 means the winning trades outweigh the losing ones in this window; below 1.0 means the opposite, regardless of what win rate shows.
- Net P/L — the net result after commission and swap, colour-coded so a losing window is visually obvious at a glance.
- Win streak / Loss streak — how many trades in a row have closed the same way, counting back from the most recent trade. Useful for noticing when a system has drifted out of its usual behaviour.
- Best symbol / Worst symbol — which instrument has contributed the most, and the least, to the net result inside the window. If one symbol is quietly funding the rest, this is where it shows up.
- Equity curve — the cumulative net P/L across the window, drawn as a simple line so the trend is visible without reading a single number.
None of these numbers are trading signals. The panel exists to answer one question honestly every time you look at it: is this actually working, or does it just feel like it is?
External variables (inputs)
Every input is grouped in the Inputs tab under Panel, Data Scope, and Colors, and can be changed per chart without editing the code:
| Input | Default | Purpose |
|---|---|---|
| InpCorner | Left Upper | Which chart corner the panel is anchored to. |
| InpOffsetX / InpOffsetY | 12 / 18 | Pixel offset of the panel from that corner. |
| InpPanelWidth / InpPanelHeight | 300 / 250 | Panel size in pixels. |
| InpRefreshSecs | 5 | How often the panel re-reads history and redraws, independent of ticks. |
| InpHistoryDays | 90 | How many days of closed-deal history to pull into the stats. |
| InpAllSymbols | true | true aggregates every symbol traded on the account; false restricts the panel to the current chart's symbol only. |
| InpBackColor | dark navy | Panel background colour. |
| InpBorderColor | amber | Panel border colour. |
| InpTextColor | off-white | Primary label and value text colour. |
| InpAccentColor | amber | Colour of the panel title text. |
| InpProfitColor | blue | Colour used for a positive net result, a winning streak, and a rising equity curve. |
| InpLossColor | red | Colour used for a negative net result, a losing streak, and a falling equity curve. |
Recommended use
This is an indicator, not an Expert Advisor, so it is not tied to a particular symbol or timeframe — attach it to any chart and it reads your account's history rather than that chart's price data. If you trade several symbols on one account, leave InpAllSymbols on for the full picture, or turn it off on a specific chart to judge that instrument on its own.
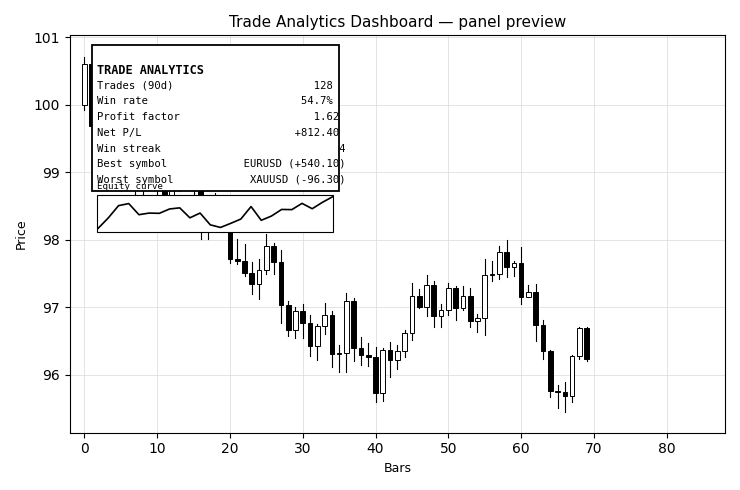
Fig. 1. The panel as it appears on a chart: trade count, win rate, profit factor, net P/L, current streak, best/worst symbol, and the equity curve sparkline. Rendered in black and white per the Code Base image guidelines.
SAX Forecaster
A forecaster made from Symbolic Aggregate approXimation (SAX)
Session Scalping Zones
Session-Based Scalping Indicator for MetaTrader 5. It automatically marks the Asian session high and low, then generates scalping signals at the London open when price breaks or retests those levels. The indicator draws dynamic session ranges, sends alerts and push notifications, and includes optional trend, volume and time filters. Works on M1, M5 and M15 charts for any symbol.
Sessionvolatilityheatmap
Shows average price range per hour of the trading day as an on-chart heatmap, plus Asian/London/New York session shading behind the candles — so you can see when a symbol actually moves, not just guess.
EVT Crash Gauge
Extreme Value Theory (EVT) ported into MQL5 for gauging potential crashes and upsets in the market.