 MetaTrader 5
 Experts
 Indicators
 Scripts
 Libraries
 Storage
Watch how to download trading robots for free
Find us on Twitter!
Join our fan page
Join our fan page
You liked the script? Try it in the MetaTrader 5 terminal

Timeframe Quality Analyzer - indicator for MetaTrader 5
Rajesh Kumar Nait

Hi, I'm Rajesh, a MQL Developer with a B.Tech in Information Technology. With over 12 years of programming experience, I've transitioned from being a PHP developer, specializing in web development, to a full-time MQL5 programmer and crypto trader. Having expert level experience in coding EA related
- Views:
- 4537
- Rating:
- Published:
- Updated:
-
 You are missing trading opportunities:
- Free trading apps
- Over 8,000 signals for copying
- Economic news for exploring financial markets
Registration Log inYou agree to website policy and terms of use
If you do not have an account, please register -
 Need a robot or indicator based on this code? Order it on Freelance
Go to Freelance
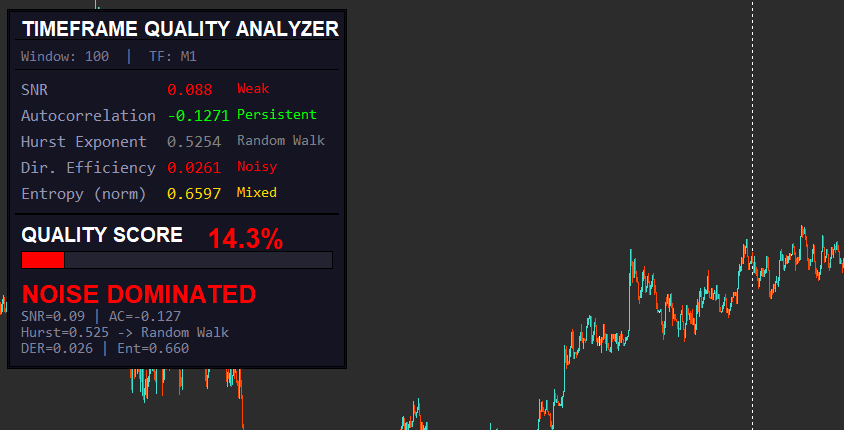
This indicator tests if a timeframe is tradeable by checking
1. Signal-to-Noise Ratio (SNR)
Fit a linear regression over a rolling window of N bars.
Compute:
Explained variance (trend component)
Residual variance (noise component)
SNR = Explained Variance / Residual Variance
2. Autocorrelation (Memory Test)
Compute autocorrelation of returns for lag=1 over rolling window.
Display value.
Color code:
Green if > 0.1 (persistence)
Red if near 0 (noise)
3. Hurst Exponent (Fractal Memory)
Interpret:
H ≈ 0.5 → random walk
H > 0.55 → trending
H < 0.45 → mean reverting
4. Volatility Clustering (Variance Stability)
Display as oscillator between 0 and 1.
5. Shannon Entropy (Randomness Test)
Discretize returns into bins.
Compute Shannon entropy:
H = - Σ p(x) log(p(x))
Normalize between 0 and 1.
Higher entropy = more randomness.
BEST INPUT SETTINGS
A. Default Balanced (Recommended Start)
InpWindow        = 120
InpEntropyBins   = 25

InpWeightSNR     = 0.30
InpWeightAC      = 0.10
InpWeightHurst   = 0.25
InpWeightDER     = 0.20
InpWeightEntropy = 0.15
Why:
-
Larger window → reduces noise
-
Higher SNR weight → trend detection
-
Lower AC → autocorrelation is unstable
B. Trend Following Mode (Best for Breakouts)
InpWindow        = 150
InpEntropyBins   = 30

InpWeightSNR     = 0.35
InpWeightAC      = 0.05
InpWeightHurst   = 0.30
InpWeightDER     = 0.20
InpWeightEntropy = 0.10
Use when:
-
Market trending strongly
-
Trading breakout / momentum
Focus: trend + persistence
C. Scalping / Intraday Mode
InpWindow        = 80
InpEntropyBins   = 20

InpWeightSNR     = 0.20
InpWeightAC      = 0.20
InpWeightHurst   = 0.20
InpWeightDER     = 0.25
InpWeightEntropy = 0.15
Use when:
-
M1–M15 trading
-
Need fast adaptation
Focus: structure + efficiency
D. Anti-Chop Filter Mode (VERY POWERFUL)
InpWindow        = 100
InpEntropyBins   = 25

InpWeightSNR     = 0.25
InpWeightAC      = 0.10
InpWeightHurst   = 0.20
InpWeightDER     = 0.15
InpWeightEntropy = 0.30
Use when:
-
You want to avoid bad market conditions
High entropy weight = avoid noise
WPR With TPSL
WPR indicator in chart window with TPSL
ZigZag BOS CHoCH Detection
ZigZag BOS CHoCH Detection indicator is based on the original MetaQuotes ZigZag algorithm and extends it by detecting and marking market structure events. It tracks recent ZigZag swing points and automatically identifies Break of Structure (BOS) and Change of Character (CHoCH) using pivot trend confirmation. BOS and CHoCH levels are drawn directly on the chart with labeled horizontal lines for clearer price action analysis.
 nCalculate Lot by Percent
Function of lot calculation by risk percentage
WPR for Overbought and Oversold
Overbought and oversold indicators aim to determine where the price may experience a reversal.