 MetaTrader 5
 Experts
 Indicators
 Scripts
 Libraries
 Storage
Watch how to download trading robots for free
Find us on Telegram!
Join our fan page
Join our fan page
You liked the script? Try it in the MetaTrader 5 terminal

Boom Index Spike Pattern - indicator for MetaTrader 5

- Views:
- 10298
- Rating:
- Published:
- Updated:
-
 You are missing trading opportunities:
- Free trading apps
- Over 8,000 signals for copying
- Economic news for exploring financial markets
Registration Log inYou agree to website policy and terms of use
If you do not have an account, please register -
 Need a robot or indicator based on this code? Order it on Freelance
Go to Freelance
Bullish Spike Pattern Detection
-
3-bar pattern:
-
1st candle: Green with large body (bullish spike).
-
2nd candle: Red (pullback).
-
3rd candle: Green with large body (bullish spike).
-
-
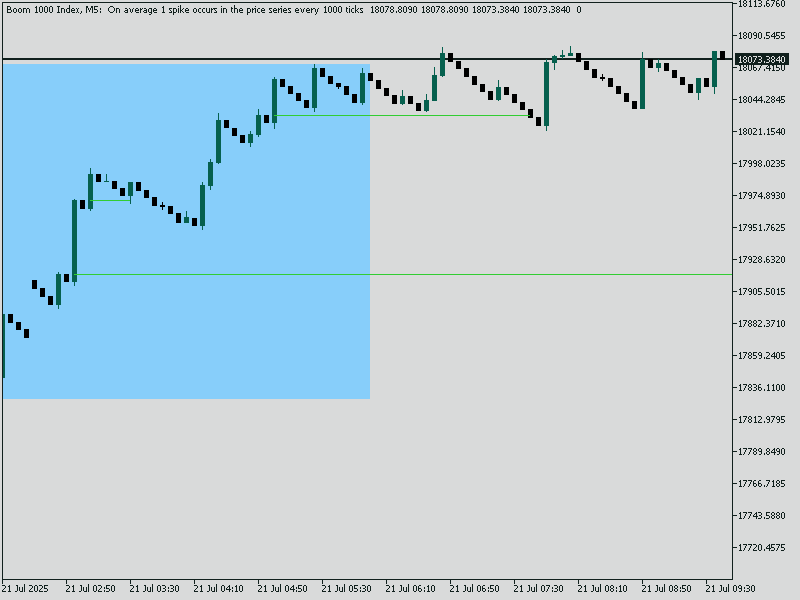
When this pattern appears, a zone is created.
Zone Creation
-
A blue rectangle is drawn from the high/low range of the 3 candles.
-
A lime green horizontal entry line is drawn at the open price of the middle (2nd) candle.
-
The line extends far into the future until price comes back.
-

INPUTS EXPLAINED
mq5
input color BoxColor = clrBlue;              // Color of the 3-candle pattern box
input color EntryLineColor = clrLime;        // Color of the entry line
input ENUM_LINE_STYLE EntryLineStyle = STYLE_SOLID; // Style of the entry line
input int BoxWidth = 2;                      // Width of box border
input int EntryLineWidth = 2;                // Width of entry line
input int EntryLineLength = 200;             // How far the mitigation line extends
```
These inputs let you fully control the style of the box and entry line.
CORE IDEA
We look for a 3-candle bullish pattern
1. First candle– strong bullish (spike)
2. Second candle – bearish retracement
3. Third candle– strong bullish spike again
When this appears, we draw:
- A box around the pattern
- A horizontal line at the 2nd candle’s open (entry point
Once price returns to that line ("mitigation"), we cut the line short and avoid redrawing it.
DATA STRUCTURES
struct PatternInfo {
  datetime time;   // Time of the pattern
  double entry;    // Entry price (open of 2nd candle)
  double high;     // Highest high of the 3 candles
  double low;      // Lowest low of the 3 candles
  bool mitigated;  // Has price returned to entry level?
};

CArrayObj activePatterns;
```
We use a struct `PatternInfo` to track each valid pattern and store it in an array. This helps avoid repeated processing.
ON INIT FUNCTION
int OnInit() {
  IndicatorSetInteger(INDICATOR_DIGITS, _Digits);
  ArrayInitialize(activePatterns, 0);
  return INIT_SUCCEEDED;
}
```
We set the indicator precision and prepare our array.
PATTERN DETECTION (ON EACH TICK)
```mq5
for (int i = limit - 3; i >= 0; i--) {
```
We loop through candles and look 3 bars back.

```mq5
if (isBullish(i+2) && isBearish(i+1) && isBullish(i))
```
We check if the last 3 candles fit the spike pattern: Green-Red-Green.

```mq5
double high = MathMax(MathMax(High[i], High[i+1]), High[i+2]);
double low = MathMin(MathMin(Low[i], Low[i+1]), Low[i+2]);
double entry = Open[i+1];
```
We extract high/low for box and the entry level from the 2nd (middle) candle.

```mq5
PatternInfo *pattern = new PatternInfo;
pattern.time = Time[i];
pattern.entry = entry;
pattern.high = high;
pattern.low = low;
pattern.mitigated = false;
```
Create and add this pattern to our list.
DRAW BOX AND LINE
```mq5
string boxName = "Box_" + IntegerToString(Time[i]);
ObjectCreate(0, boxName, OBJ_RECTANGLE, 0, Time[i+2], high, Time[i], low);
```
Draw the rectangle (box) from the 3-candle pattern.

```mq5
string lineName = "EntryLine_" + IntegerToString(Time[i]);
ObjectCreate(0, lineName, OBJ_TREND, 0, Time[i], entry, Time[i] + PeriodSeconds() * EntryLineLength, entry);
```
Draw the entry line from the 2nd candle’s open forward in time.
MITIGATION CHECK (ON EACH TICK)
Loop through all patterns:
```mq5
for (int p = 0; p < activePatterns.Total(); p++) {
  PatternInfo *pt = (PatternInfo*)activePatterns.At(p);
```
If not already mitigated, check:
```mq5
if (!pt.mitigated && Low[0] <= pt.entry)
```
If current price hits the entry level:
```mq5
pt.mitigated = true;
ObjectDelete("EntryLine_" + IntegerToString(pt.time));
```
Delete original long line.

```mq5
ObjectCreate(0, "MitigatedLine_" + IntegerToString(pt.time), OBJ_TREND, 0,
pt.time, pt.entry,
Time[0], pt.entry);
```
Create a short line showing where mitigation happened.
HELPER FUNCTIONS
### Check Bullish/Bearish:
```mq5
bool isBullish(int i) {
return Close[i] > Open[i];
}
bool isBearish(int i) {
return Close[i] < Open[i];
}This indicator is simple yet powerful:
- Detects real spike behavior in Boom
- Visualizes smart money entries
- Automatically detects mitigation
You can now test it live on Boom 500 or Boom 1000.
thanks comment if you want to ask or share .
 CBitBuffer Class - Data Serialization in MQL5
A class for reading and writing individual bits or bit sequences to and from a buffer.
Crash Spike Trade Pattern
This indicator detects a specific bearish spike formation over 3 candles
 Seven strategies in One expert
Name of expert is 'MultiStrategyEA'
ServerTime
A lightweight, customizable tool that displays server time on your chart for precise trading decisions.