Watch how to download trading robots for free
Find us on Twitter!
Join our fan page
Join our fan page
You liked the script? Try it in the MetaTrader 5 terminal
- Views:
- 197
- Rating:
- Published:
- 2025.05.06 06:58
-
 You are missing trading opportunities:
- Free trading apps
- Over 8,000 signals for copying
- Economic news for exploring financial markets
Registration Log inYou agree to website policy and terms of use
If you do not have an account, please register -
 Need a robot or indicator based on this code? Order it on Freelance
Go to Freelance
Need a robot or indicator based on this code? Order it on Freelance
Go to Freelance
 RSI Timeframe Analyzer - MT4 Indicator
A powerful multi-timeframe RSI dashboard that visually displays the overbought, oversold, and neutral RSI status across 9 different timeframes — from M1 to MN1.
 EA Stochastic Bollinger Bands Multi - Timeframe
This MQL4 code implements an Expert Advisor (EA) that trades based on the Stochastic Oscillator and Bollinger Bands indicators across multiple timeframes (M1, M5, and M15).
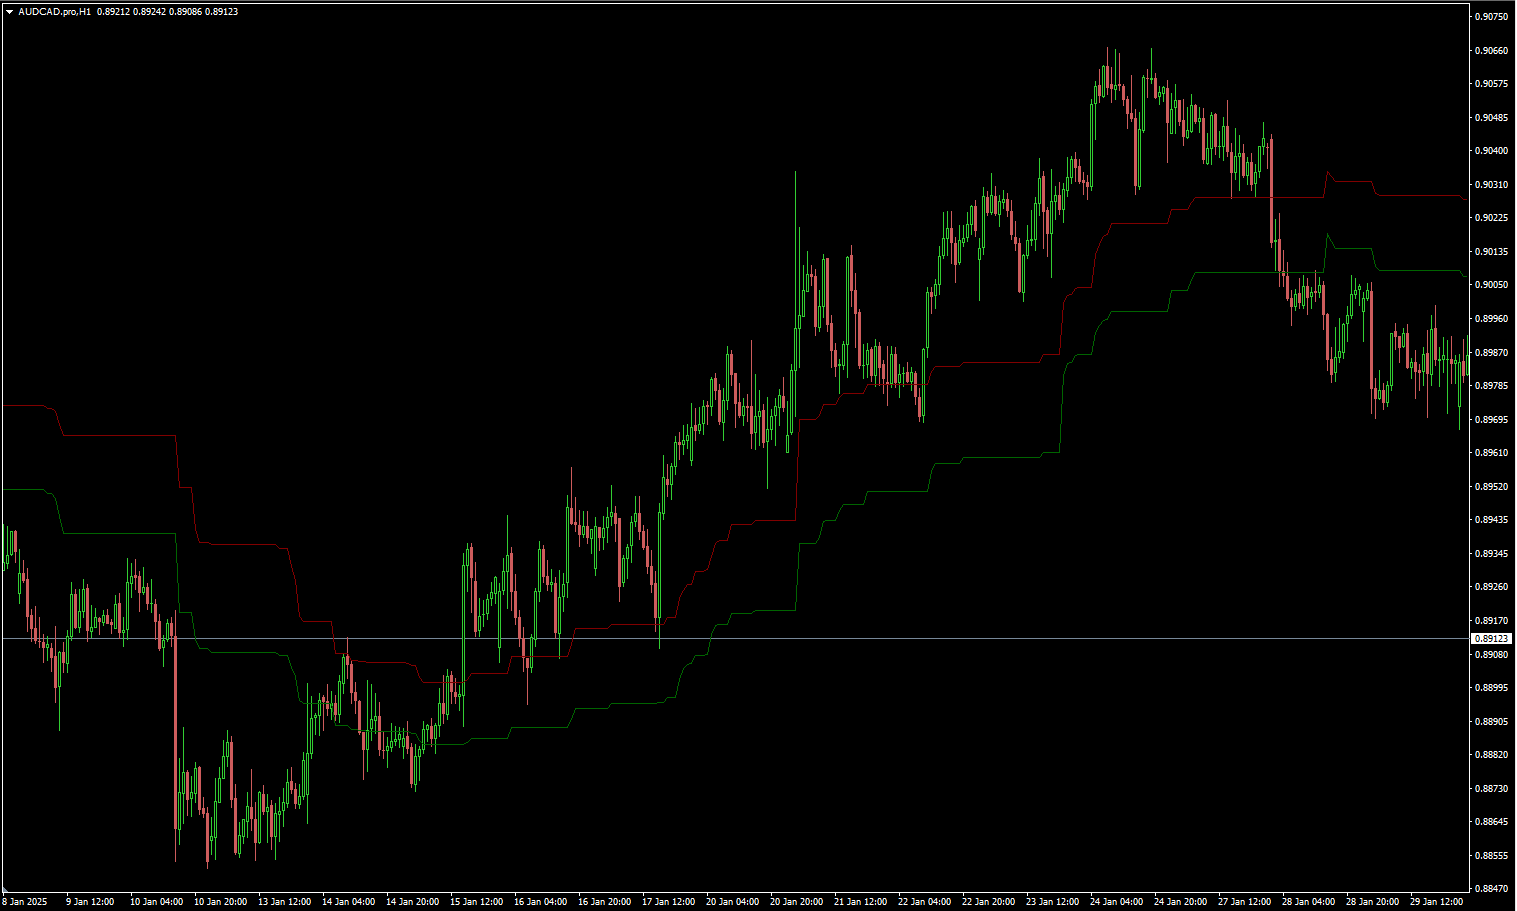
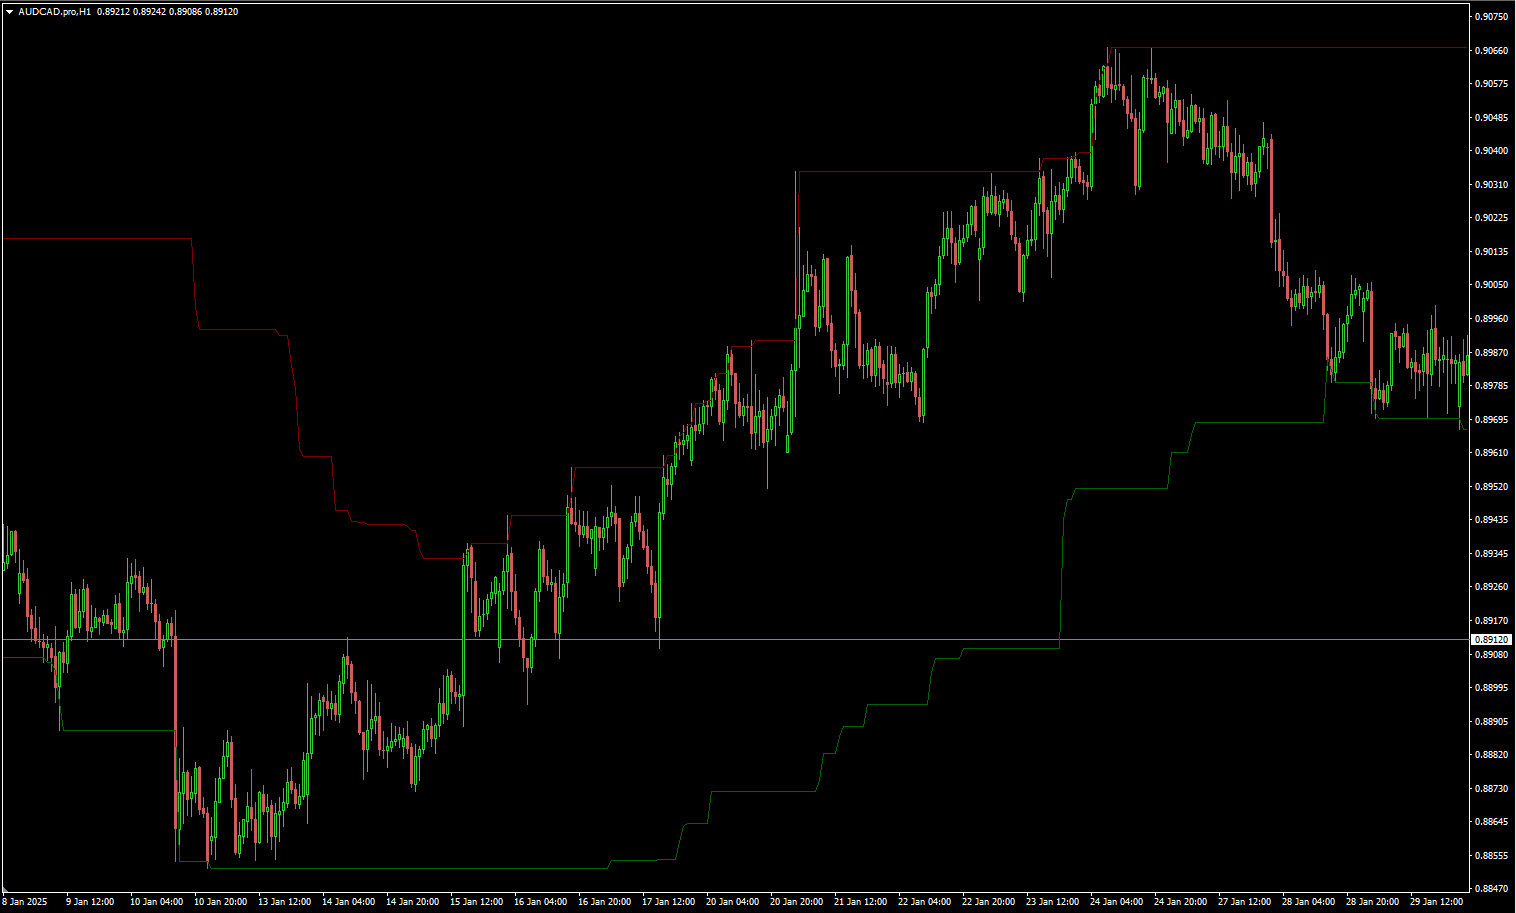
Three Colors
Example: Moving Average indicator filling by different colors
MACD Sample
Classical MACD Sample.