Join our fan page

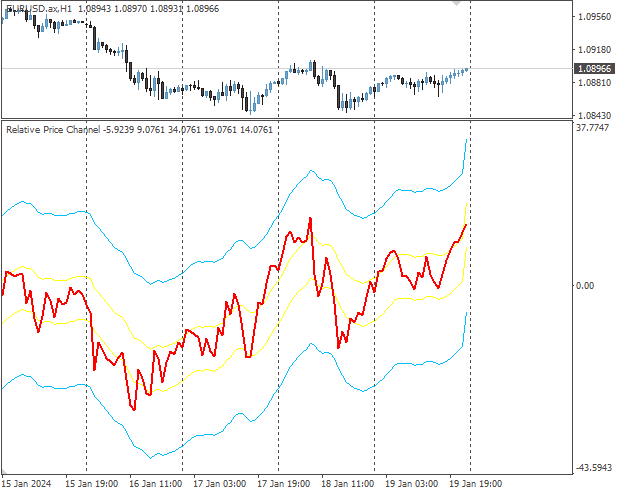
Relative Price Channel - indicator for MetaTrader 4

- Views:
- 12524
- Rating:
- Published:
-
 You are missing trading opportunities:
- Free trading apps
- Over 8,000 signals for copying
- Economic news for exploring financial markets
Registration Log inYou agree to website policy and terms of use
If you do not have an account, please register -
 Need a robot or indicator based on this code? Order it on Freelance
Go to Freelance
Need a robot or indicator based on this code? Order it on Freelance
Go to Freelance
MT4 version of original indicator: https://www.mql5.com/en/code/22576
Since the MT4 functionality is limited in the methods of drawing indicators, there are no color zones, but their boundaries are in place.
Basics:
RSI indicator is frequently used in trading decisions coupled with levels checking. Levels are supposed to show if there is overbought or oversold condition. But frequently we are neglecting the fact that the market is adjusting itself to price changes, and that indicators like RSI may actually show overbought and oversold conditions even when the market already adjusted itself.
This version:
It is using the RSI and is constructing an high and low neutral zones using a simple EMA lag - in this case the lag of an average is our ally - without adding that lag, the breakout will never happen. When the RSI crosses the top most or lowest bound, only then consider that a "real" overbought or oversold condition is happening.
Usage:
You can use it for possible reversal conditions detecting.
 Bounce Number for Grid/Martingale strategies Lot Sizing/Order Count set
When we want to know how many times price will goes up and down 40 pips before breaking this channel, we will need Bounce Number tool.
SSH Multi Time-Frame
SSH is popular indicator as it uses simply two moving averages. This version is a mylti-TF of SSH with TF change ability from screen.
Candle Gain Candle Loss
Displays the gains and losses for all candles where the given threshold is surpassed. The values are calculated in points and percentage.
 Titik Impas Breakeven MT4
The Breakeven Point, or Titik Impas, denotes the price level at which a trade's profit becomes zero. By setting a position to Titik Impas Breakeven, the stop-loss is aligned with the position's opening price. This strategy proves valuable when you aim to allow profits to accumulate while ensuring that the trade remains secure and does not revert to negative territory.