Join our fan page

wd.Multi_LineMA - indicator for MetaTrader 5

- Views:
- 7940
- Rating:
- Published:
- Updated:
-
 You are missing trading opportunities:
- Free trading apps
- Over 8,000 signals for copying
- Economic news for exploring financial markets
Registration Log inYou agree to website policy and terms of use
If you do not have an account, please register -
 Need a robot or indicator based on this code? Order it on Freelance
Go to Freelance
Need a robot or indicator based on this code? Order it on Freelance
Go to Freelance
The MT5 custom indicator, named "wd.Multi_LineMA.mq5," is designed to offer traders valuable insights into Moving Average values from a higher timeframe (MTF Multi TimeFrame). It encompasses additional visual features for in-depth analysis, such as the ability to view trails for a specified number of bars and a dynamic MA horizontal price line.
Here's how the indicator works:
MTF Multi-Timeframe Moving Average:
The indicator computes a Moving Average based on user-defined parameters like period, method, and applied price. If the current timeframe is lower than the specified higher timeframe, it retrieves Moving Average values from the higher timeframe, displaying them on the current chart. Conversely, if the current timeframe is higher than the specified one, it refrains from displaying lower timeframe Moving Average values, opting to show a limited lowerTF plot or hide lowerTF values on the current chart.
Moving Average Trail:
Featuring a Moving Average trail, the indicator allows users to adjust the trail length for a specific number of bars by changing the value in the properties.
Horizontal Price Line:
The indicator incorporates a Horizontal Price Line that dynamically moves based on the last value of the Moving Average. This line corresponds to the Moving Average, created at the current bid price level, and updates in real-time with each tick as the Moving Average value changes.
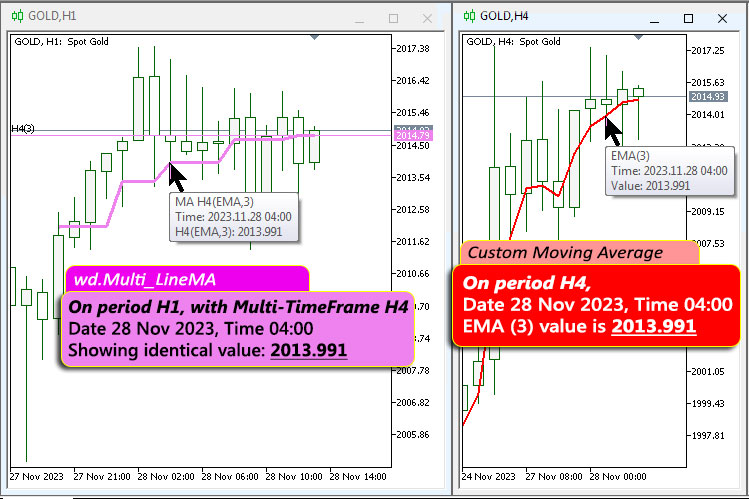
The MTF Multi-Timeframe Moving Average is calculated based on real-time values. For example, on Gold at H4, Date 28 Nov 2023, Time: 04:00, using the 'Custom Moving Average' (MetaTrader 5 built-in indicator), it shows a value of 2013.991. Similarly, using 'wd.Multi_LineMA,' it reflects an identical value of 2013.991, even when the current chart period is different.
The Moving Average Trail proves useful for observing historical movement without cluttering the chart with lines. The Horizontal Price Line facilitates price visibility and aids users in determining support and resistance lines. It serves as a reference point to visualize the current level of the Moving Average on the chart.
Overall, the indicator efficiently configures necessary parameters, initializes the Multi-Timeframe Moving Average, consistently updates the Horizontal Price Line, and manages the display of MA trails based on the relationship between timeframes. Its most significant advantage lies in enabling users to quickly and effectively identify resistance-support lines based on MA in seconds.
Candlestick Body, High Low and Wick Range
Click on candlestick to see its body range, high low range, upper wick range and lower wick range value.
Candle Time Count Down
Current Candle To Close in x Time
Engulfing bar with rsi
Alerts on engulfing bar below or above rsi levels
 Martingale Trade Simulator
a Simple Visual Strategy Tester / Manual Trade Training using Martingale.